Plotting
The PumasUtilities package provides access to the plotting functions available for Pumas and NCA. The subset of functions available for NCA can also be accessed via the NCAUtilities package.
All the available plotting functions build upon the Makie plotting ecosystem and so are interoperable with any plots created using Makie. You can freely combine individual plots from Pumas-specific functions with those of Makie, or any other plotting functions that build upon it, such as AlgebraOfGraphics.
For in-depth documentation and examples of Makie please refer directly to the documentation for that package. We will cover the basics within this document, but do not aim to give it a thorough treatment since that is best left to the official documentation.
Publication-Quality and Interactivity
By default, the plots created by all the Pumas plotting functions, as well as any produced using Makie directly, will return a Figure object which will display in the "Plot Pane" of your editor if you are using Visual Studio Code while writing your code. The plots that are displayed are for the most part static images.
If you wish to incorporate some level of interactivity while you are performing your analysis you can use the interactive function to convert the Figure into an interactive plot that allows for zooming, panning, and hover details.
julia> figure = observations_vs_time(population) # This will open the plot pane with a static plot.

julia> interactive(figure) # This will open the plot pane with an interactive plot.
Note that the complexity of the plot layout will determine whether interactive is able to produce a suitable interactive version of your plot. The data contained within your plot will by replicated, but the layout may degrade due to the limitations of the plotting library used for displaying the interactive plots. If the result is not to your liking then try to reduce the complexity of the layout by removing subplot axes from your Figure passed to interactive.
Keywords
All the plotting functions discussed in the next sections accept keyword arguments that control the different aspects of their appearance. Do note that currently the underlying Makie library will not throw an error when keyword arguments are incorrectly spelled. Because of this please carefully inspect the spelling of your keyword arguments should any of them appear to not be taking effect within the resulting plot.
Every docstring for the available plotting functions, listed in the next sections, are also available to you from within your editor and REPL, via the ? mode. They all list the possible keyword arguments that can be passed to them.
Pagination
There are instances with the plotting functions discussed below where the resulting Figure object contains numerous sub-plots rather than just a single plot. This can make creation of these complex plots difficult when very little space is available for each sub-plot.
You have two options with these cases:
Firstly, you can use several of the keywords that some of the plotting functions provide to limit the number of sub-plots. For example, the
observationscan be used to limit which out of possibly may observations from a model are displayed inFigure. Check the docstring of the particular plotting function for details of the available keywords.Secondly, all plotting functions provide a
paginatekeyword that can be set topaginate = true. The effect that this has is to programmatically split the sub-plots over multiple "pages", which are then returned as aVector{Figure}rather than the default singleFigure. The companion keywords that can be used with this in many of the plotting functions arelimit,rows, andcolumnswhich set the maximum sub-plots per page, number of rows, and number of columns respectively.
Functions
We'll cover Pumas- and NCA-specific plotting functionality separately in the next two sections.
Pumas
Firstly, to make the plotting functions available we must import the modules.
using Pumas
using PumasUtilities
PumasUtilities automatically loads PumasPlots which is Pumas' main plotting package.
To create custom plots using Makie directly you should also import one of it's "backend" packages, such as CairoMakie, with:
using CairoMakieThe following plots are now available:
convergence_tracecovariates_checkcovariates_distempirical_bayes_distempirical_bayes_vs_covariatesgoodness_of_fitiwresiduals_vs_ipredictionsiwresiduals_vs_timenpde_distnpde_vs_covariatesnpde_vs_predictionsnpde_vs_timeobservations_vs_ipredictionsobservations_vs_predictionsobservations_vs_timesim_plotsubject_fitsvpc_plotwresiduals_distwresiduals_vs_covariateswresiduals_vs_predictionswresiduals_vs_time
The plots discussed in this section only support continuous data models. Support for discrete data models will be made available soon.
For the example plots below we will be using the following Pumas' analysis results:
using Pumas
using PumasUtilities
using PharmaDatasets
using CairoMakie

pkdata = dataset("nlme_sample")

pop = read_pumas(
    pkdata;
    id = :ID,
    time = :TIME,
    amt = :AMT,
    covariates = [:WT, :AGE, :SEX, :CRCL, :GROUP],
    observations = [:DV],
    cmt = :CMT,
    evid = :EVID,
    rate = :RATE,
)

model = @model begin
    @param begin
        """
        Volume of the Central Compartment (L)
        """
        tvvc ∈ RealDomain(; lower = 0)
        """
        Volume of the Peripheral Compartment (L)
        """
        tvvp ∈ RealDomain(; lower = 0)
        """
        Intercompartmental Clearance
        """
        tvq ∈ RealDomain(; lower = 0)
        """
        Hepatic Clearance (L/hr)
        """
        tvcl_hep ∈ RealDomain(; lower = 0)
        """
        Renal Clearance (L/hr)
        """
        tvcl_ren ∈ RealDomain(; lower = 0)
        """
        Components: CL, Vc
        """
        Ω ∈ PDiagDomain(2)
        """
        Additive RUV (SD Scale)
        """
        σ_add ∈ RealDomain(; lower = 0)
        """
        Proportional RUV (SD Scale)
        """
        σ_prop ∈ RealDomain(; lower = 0)
        """
        Exponent of the Power Function of Creatinine on Renal Clearance
        """
        dCRCL ∈ RealDomain()
    end

    @random begin
        η ~ MvNormal(Ω)
    end

    @covariates begin
        """
        Body Weight (kg)
        """
        WT
        """
        Estimated Creatinine Clearance (mL/min)
        """
        CRCL
    end

    @pre begin
        hepCL = tvcl_hep * (WT / 70)^0.75 # hepatic clearance
        renCL = tvcl_ren * (CRCL / 100)^dCRCL # renal clearance
        CL = (hepCL + renCL) * exp(η[1]) # total clearance
        Vc = tvvc * (WT / 70) * exp(η[2])
        Q = tvq
        Vp = tvvp
    end

    @dynamics Central1Periph1

    @derived begin
        cp := @. Central / Vc
        """
        CTMx Concentrations (ng/mL)
        """
        DV ~ @. CombinedNormal(cp, σ_add, σ_prop)
    end
end

fitted_model = fit(model, pop, init_params(model), FOCE())

fitted_model_inspection = inspect(fitted_model)

fitted_model_inspection_npde = inspect(fitted_model; nsim = 1_000)

continuous_vpc = vpc(fitted_model)

sim = simobs(model, pop, init_params(model));
Simulated population (Vector{<:Subject})
Simulated subjects: 30
Simulated variables: DVconvergence_trace
PumasPlots.convergence_trace — Function
convergence_trace(fit | inspect)
convergence_trace(figpos, fit | inspect)
Plot the fitting trace for a given fit or inspect object. When a SAEM fit is plotted then traces for $μ$, $Ω$, and $σ$ are plotted, otherwise the -Log-Likelihood and Gradient Norm are plotted side-by-side.
Keywords
trace: select which trace to plot. When plotting into a figure position or axis then only a single trace is plotted, otherwise several can be plotted. Available trace names are as follows:@model-based::loglikelihoodand:gradientnorm, or their abbreviations:lland:gn.@emmodel-based::μ,:Ω, and:σ, or their fullnames:mu,:Omega, and:sigma.
paginate: (defaultfalse) Whentruesets the return type of a plot to aVector{Makie.Figure}rather thanMakie.Figurewhich splits the returned plot over several "pages" if there are too many to fit on a single figure comfortably. See also thelimitkeyword which can be used to set the limit of figures per page.limit: Sets the maximum number of axes that can be plotted per page when pagination is active.rows: Sets the maximum number of rows of subplots to be displayed on each paginatedMakie.Figurewhen pagination is active.columns: Sets the maximum number of columns of subplots to be displayed on each paginatedMakie.Figurewhen pagination is active.axis: A key-value object with axis options that gets passed to the underlyingAlgebraOfGraphics.drawcall.figure: A key-value object with figure options that gets passed to the underlyingAlgebraOfGraphics.drawcall. (Does not apply when plotting into an existing figure.)legend: A key-value object with legend options that gets passed to the underlyingAlgebraOfGraphics.drawcall. (Does not apply when plotting into an existing figure.) A legend will be drawn automatically unlesslegend = (; show = false)is set.facet: A key-value object with facet options that gets passed to the underlyingAlgebraOfGraphics.drawcall.colorbar: A key-value object with colorbar options that gets passed to the underlyingAlgebraOfGraphics.drawcall. (Does not apply when plotting into an existing figure.)
Supported Style Keywords
colorcolormaplinewidthlinestyle
For the fitted_model_inspection variable above the following syntax is used to generate the plot below:
convergence_trace(fitted_model_inspection)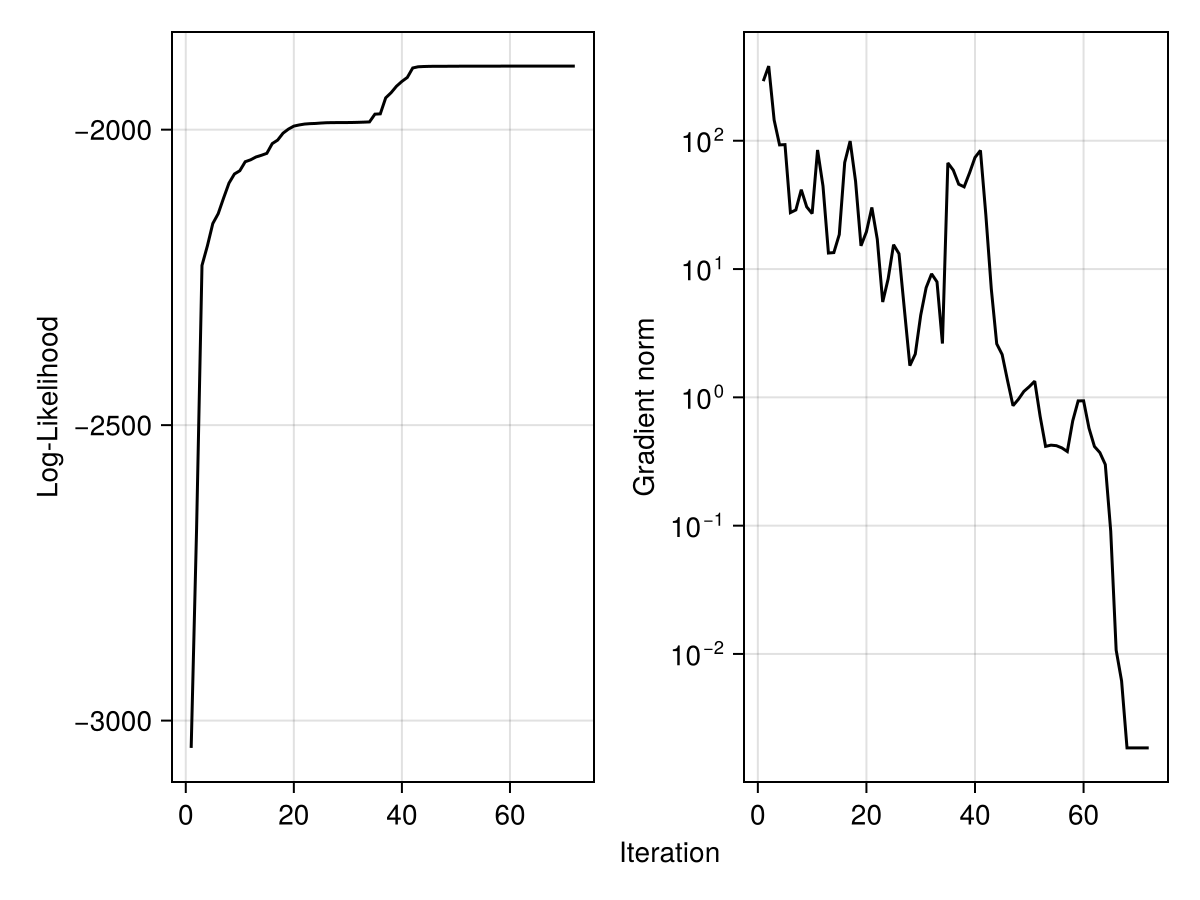
covariates_check
PumasPlots.covariates_check — Function
covariates_check([model,] subject | population | fit | inspect)
covariates_check(figpos, [model,] subject | population | fit | inspect)
Plot a scatter plot of IDs against covariates of the given population. Optionally the associated model may also be passed in as the first argument which can provide more detailed y-axis labels based on the descriptions provided in the model definition. Passing a fit or inspect do not require the model argument as well.
Keywords
covariates: The covariates to be plotted. When not specified then all covariates for the given model will be shown. A subset of covariates can be plotted by providing aSymbolorVector{Symbol}of covariate names.paginate: (defaultfalse) Whentruesets the return type of a plot to aVector{Makie.Figure}rather thanMakie.Figurewhich splits the returned plot over several "pages" if there are too many to fit on a single figure comfortably. See also thelimitkeyword which can be used to set the limit of figures per page.limit: Sets the maximum number of axes that can be plotted per page when pagination is active.rows: Sets the maximum number of rows of subplots to be displayed on each paginatedMakie.Figurewhen pagination is active.columns: Sets the maximum number of columns of subplots to be displayed on each paginatedMakie.Figurewhen pagination is active.axis: A key-value object with axis options that gets passed to the underlyingAlgebraOfGraphics.drawcall.figure: A key-value object with figure options that gets passed to the underlyingAlgebraOfGraphics.drawcall. (Does not apply when plotting into an existing figure.)legend: A key-value object with legend options that gets passed to the underlyingAlgebraOfGraphics.drawcall. (Does not apply when plotting into an existing figure.) A legend will be drawn automatically unlesslegend = (; show = false)is set.facet: A key-value object with facet options that gets passed to the underlyingAlgebraOfGraphics.drawcall.colorbar: A key-value object with colorbar options that gets passed to the underlyingAlgebraOfGraphics.drawcall. (Does not apply when plotting into an existing figure.)
Supported Stype Keywords
colormarkermarkersize
For the model and pop variables above the following syntax is used to generate the plot below:
covariates_check(model, pop)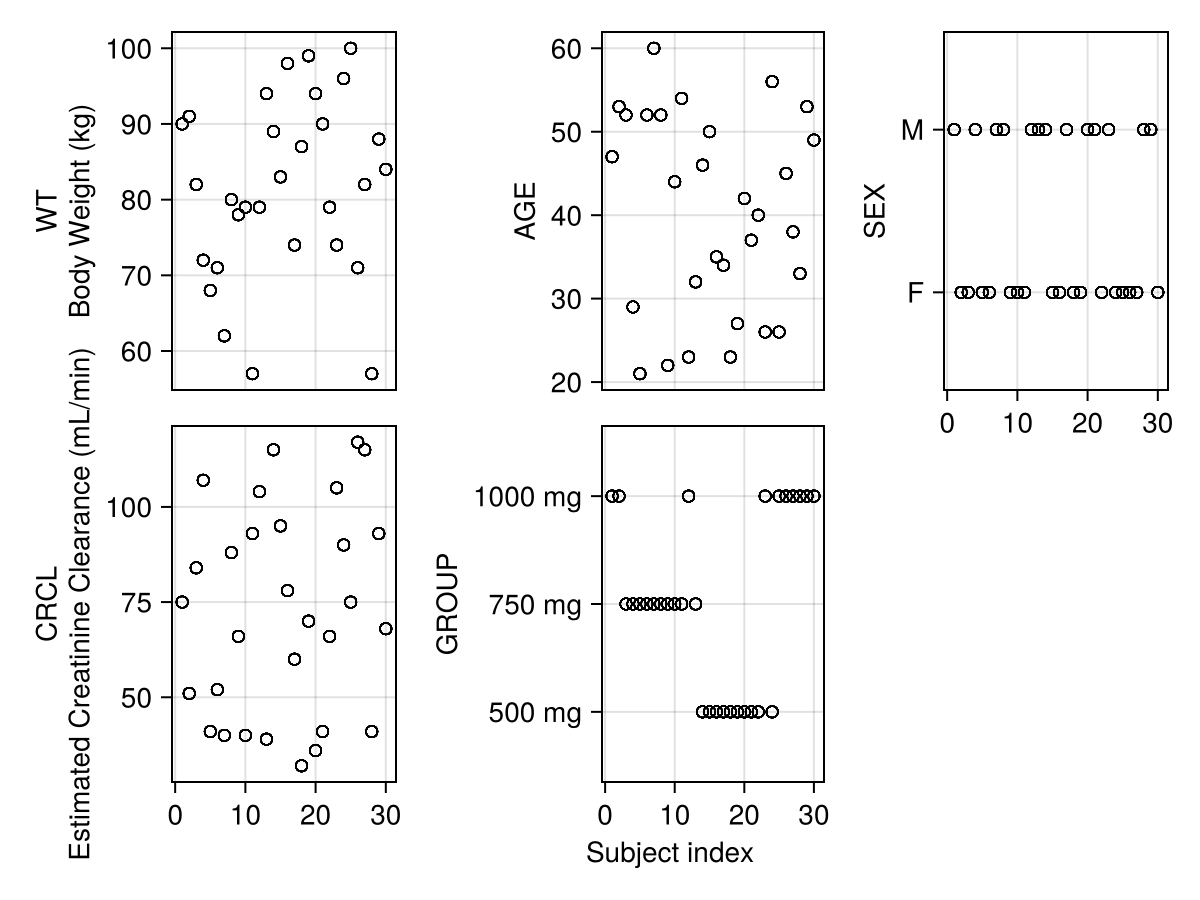
covariates_dist
PumasPlots.covariates_dist — Function
covariates_dist([model,], subject | population | fit | inspect)
covariates_dist(figpos, [model,], subject | population | fit | inspect)
Plot the distribution of covariates for the given population. An optional associated model may be passed in as the first argument which will be used to provide more detailed axis labels based on the metadata and descriptions provided in the model definition, if any. A single fit or inspect object may also be used in place of the model and population arguments.
Keywords
covariates: The covariates to be plotted. When not specified then all covariates for the given model will be shown. A subset of covariates can be plotted by providing aSymbolorVector{Symbol}of covariate names.categorical: Select which of the variables should be interpreted as categorical. Provide a vector of symbols corresponding to the names of the categorical variables. By default all variables are treated as continuous.paginate: (defaultfalse) Whentruesets the return type of a plot to aVector{Makie.Figure}rather thanMakie.Figurewhich splits the returned plot over several "pages" if there are too many to fit on a single figure comfortably. See also thelimitkeyword which can be used to set the limit of figures per page.limit: Sets the maximum number of axes that can be plotted per page when pagination is active.rows: Sets the maximum number of rows of subplots to be displayed on each paginatedMakie.Figurewhen pagination is active.columns: Sets the maximum number of columns of subplots to be displayed on each paginatedMakie.Figurewhen pagination is active.axis: A key-value object with axis options that gets passed to the underlyingAlgebraOfGraphics.drawcall.figure: A key-value object with figure options that gets passed to the underlyingAlgebraOfGraphics.drawcall. (Does not apply when plotting into an existing figure.)legend: A key-value object with legend options that gets passed to the underlyingAlgebraOfGraphics.drawcall. (Does not apply when plotting into an existing figure.) A legend will be drawn automatically unlesslegend = (; show = false)is set.facet: A key-value object with facet options that gets passed to the underlyingAlgebraOfGraphics.drawcall.colorbar: A key-value object with colorbar options that gets passed to the underlyingAlgebraOfGraphics.drawcall. (Does not apply when plotting into an existing figure.)
Supported Style Keywords
colorstrokecolorstrokewidth
For the model and pop variables above the following syntax is used to generate the plot below:
covariates_dist(model, pop; categorical = [:SEX, :GROUP])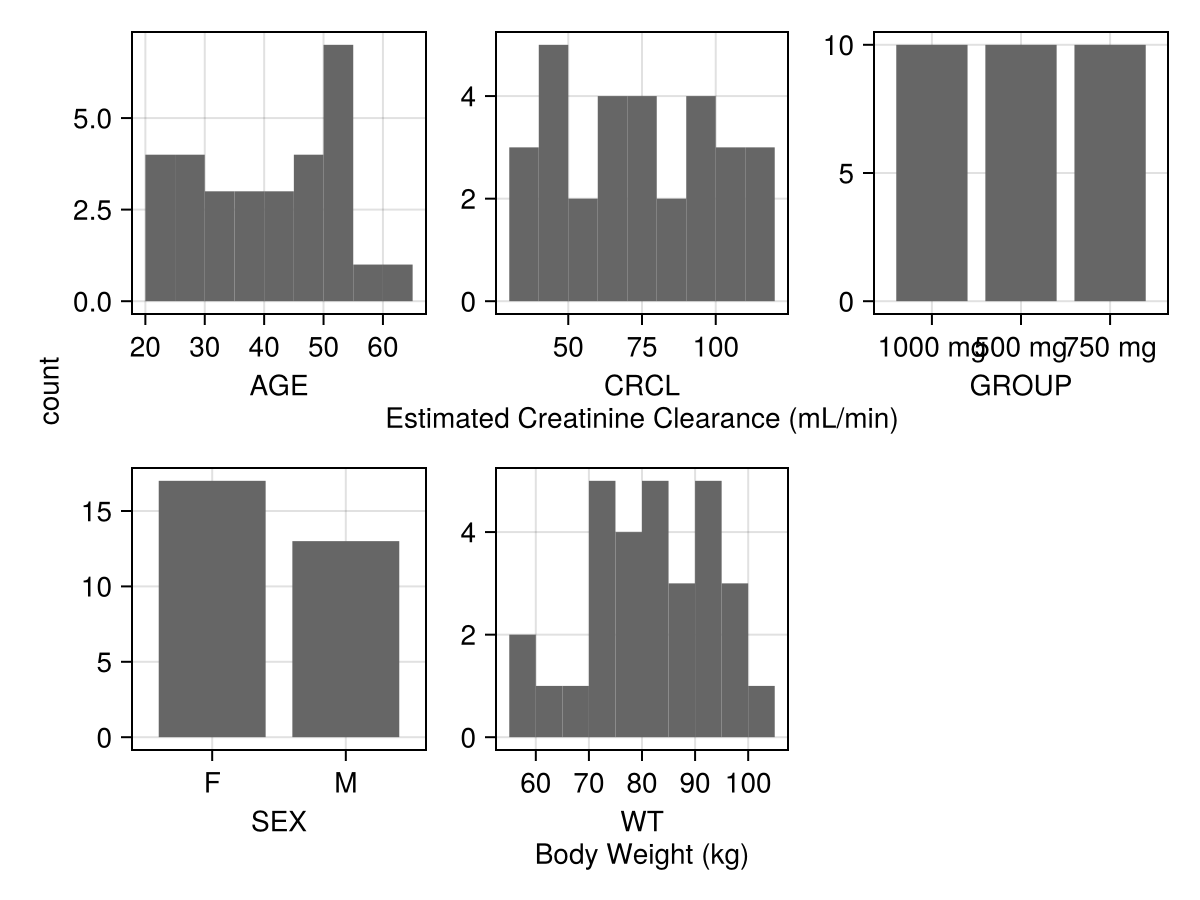
empirical_bayes_dist
PumasPlots.empirical_bayes_dist — Function
empirical_bayes_dist(inspect)
empirical_bayes_dist(figpos, inspect)
Plot the distribution of random effects for the given inspect object. Axis label will be based on the metadata and descriptions provided in the model's definition, if any.
Keywords
ebes: Select which variable, as aSymbol, to plot. By default plots all available. Provide aVector{Symbol}to plot a subset of all available variables.zeroline: Include a zeroline in the plot. Default istrue.paginate: (defaultfalse) Whentruesets the return type of a plot to aVector{Makie.Figure}rather thanMakie.Figurewhich splits the returned plot over several "pages" if there are too many to fit on a single figure comfortably. See also thelimitkeyword which can be used to set the limit of figures per page.limit: Sets the maximum number of axes that can be plotted per page when pagination is active.rows: Sets the maximum number of rows of subplots to be displayed on each paginatedMakie.Figurewhen pagination is active.columns: Sets the maximum number of columns of subplots to be displayed on each paginatedMakie.Figurewhen pagination is active.axis: A key-value object with axis options that gets passed to the underlyingAlgebraOfGraphics.drawcall.figure: A key-value object with figure options that gets passed to the underlyingAlgebraOfGraphics.drawcall. (Does not apply when plotting into an existing figure.)legend: A key-value object with legend options that gets passed to the underlyingAlgebraOfGraphics.drawcall. (Does not apply when plotting into an existing figure.) A legend will be drawn automatically unlesslegend = (; show = false)is set.facet: A key-value object with facet options that gets passed to the underlyingAlgebraOfGraphics.drawcall.colorbar: A key-value object with colorbar options that gets passed to the underlyingAlgebraOfGraphics.drawcall. (Does not apply when plotting into an existing figure.)
Supported Style Keywords
colorstrokecolorstrokewidthzeroline_colorzeroline_linestylezeroline_linewidth
For the fitted_model_inspection variable above the following syntax is used to generate the plot below:
empirical_bayes_dist(fitted_model_inspection)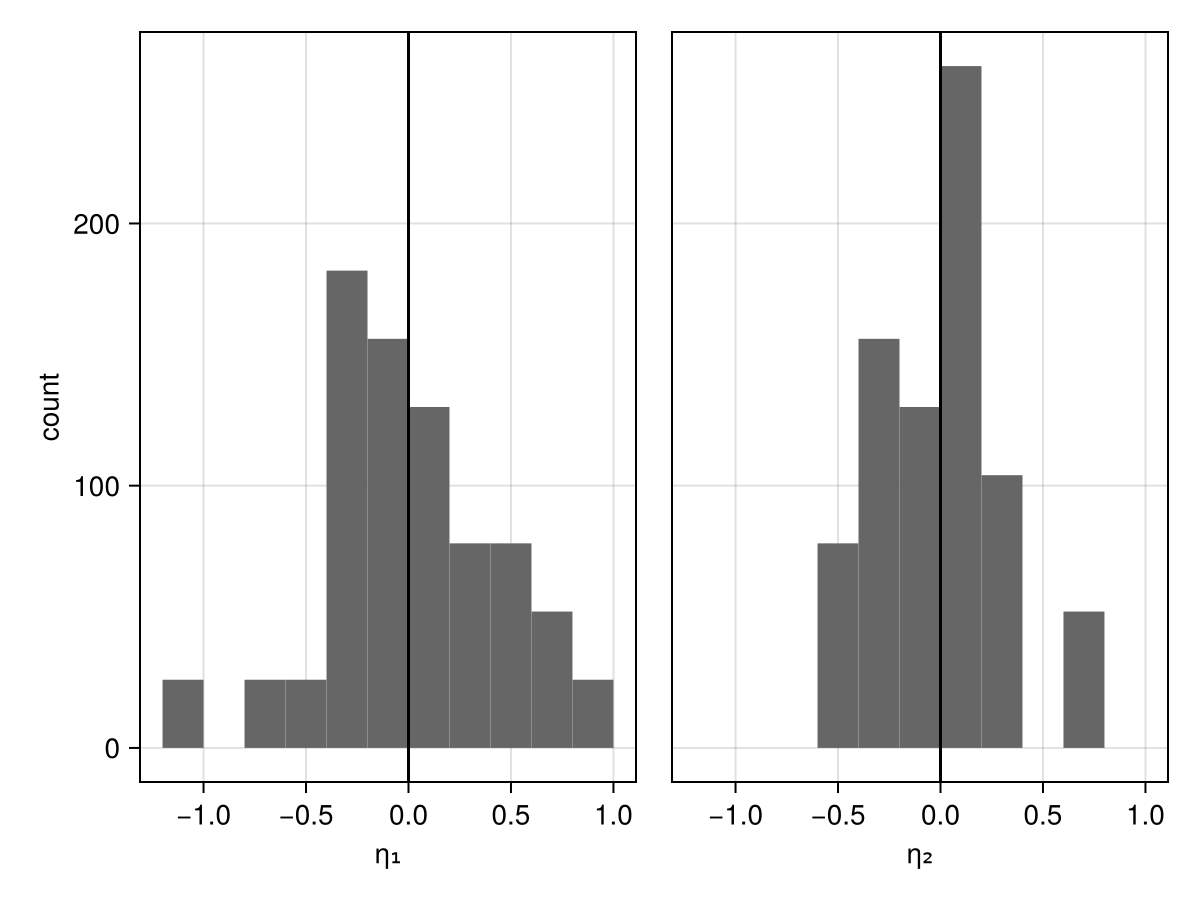
empirical_bayes_vs_covariates
PumasPlots.empirical_bayes_vs_covariates — Function
empirical_bayes_vs_covariates(inspect)
empirical_bayes_vs_covariates(figpos, inspect)
Plot the random effects versus covariates for the given inspect object. Axis label will be based on the metadata and descriptions provided in the model's definition, if any. Reports the Pearson correlation coefficient r.
Keywords
categorical: Select which of the variables should be interpreted as categorical. Provide a vector of symbols corresponding to the names of the categorical variables. By default all variables are treated as continuous.covariates: The covariates to be plotted. When not specified then all covariates for the given model will be shown. A subset of covariates can be plotted by providing aSymbolorVector{Symbol}of covariate names.ebes: Select which variable, as aSymbol, to plot. By default plots all available. Provide aVector{Symbol}to plot a subset of all available variables.zeroline: Include a zeroline in the plot. Default istrue.paginate: (defaultfalse) Whentruesets the return type of a plot to aVector{Makie.Figure}rather thanMakie.Figurewhich splits the returned plot over several "pages" if there are too many to fit on a single figure comfortably. See also thelimitkeyword which can be used to set the limit of figures per page.limit: Sets the maximum number of axes that can be plotted per page when pagination is active.rows: Sets the maximum number of rows of subplots to be displayed on each paginatedMakie.Figurewhen pagination is active.columns: Sets the maximum number of columns of subplots to be displayed on each paginatedMakie.Figurewhen pagination is active.axis: A key-value object with axis options that gets passed to the underlyingAlgebraOfGraphics.drawcall.figure: A key-value object with figure options that gets passed to the underlyingAlgebraOfGraphics.drawcall. (Does not apply when plotting into an existing figure.)legend: A key-value object with legend options that gets passed to the underlyingAlgebraOfGraphics.drawcall. (Does not apply when plotting into an existing figure.) A legend will be drawn automatically unlesslegend = (; show = false)is set.facet: A key-value object with facet options that gets passed to the underlyingAlgebraOfGraphics.drawcall.colorbar: A key-value object with colorbar options that gets passed to the underlyingAlgebraOfGraphics.drawcall. (Does not apply when plotting into an existing figure.)
Supported Style Keywords
colormarkermarkersizezeroline_colorzeroline_linestylezeroline_linewidth
For the fitted_model_inspection variable above the following syntax is used to generate the plot below:
empirical_bayes_vs_covariates(fitted_model_inspection; categorical = [:SEX, :GROUP])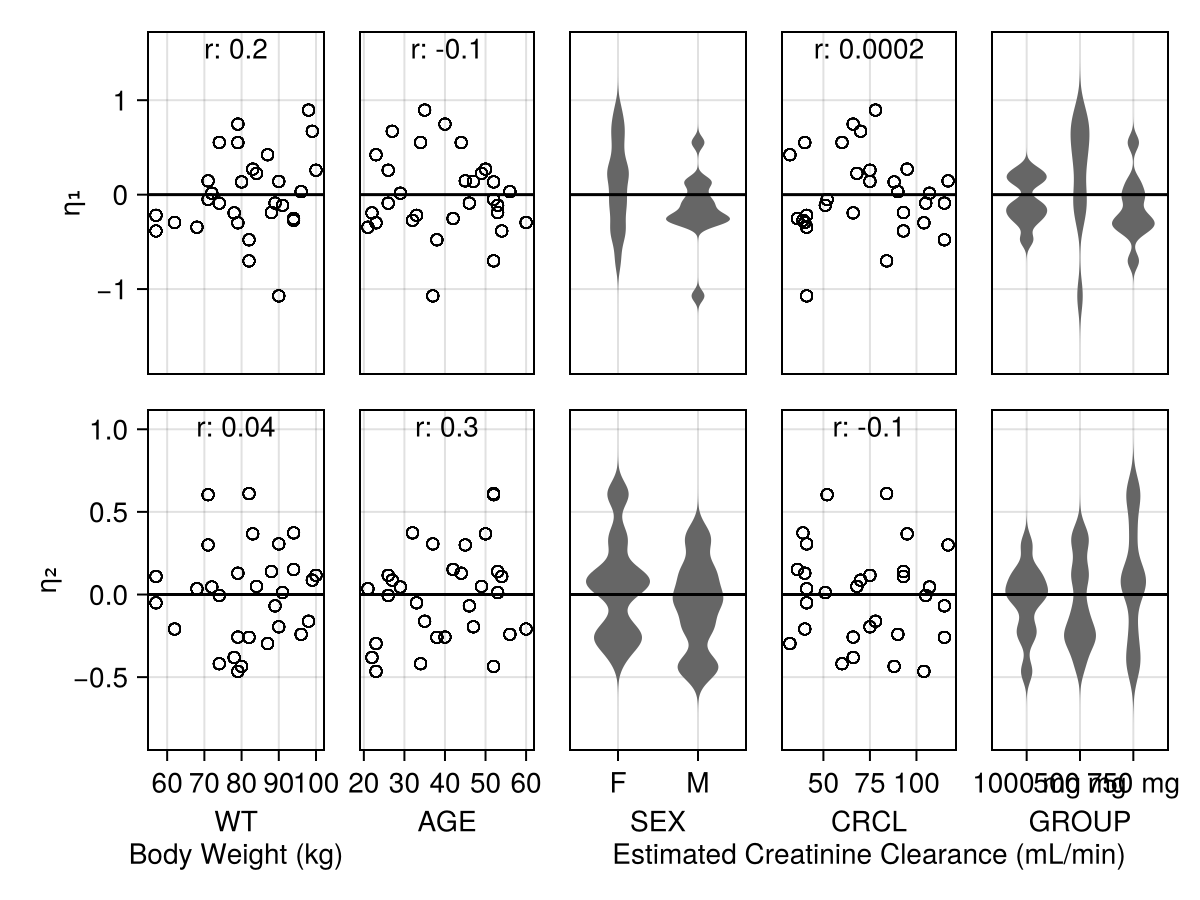
goodness_of_fit
PumasPlots.goodness_of_fit — Function
goodness_of_fit(inspect)Plot a 2-by-2 grid of subplots for each observation associated with the inspect object. The plots included are:
observations_vs_predictionsobservations_vs_ipredictionswresiduals_vs_time(ornpde_vs_time)wresiduals_vs_predictions(ornpde_vs_predictions)
Axis label will be based on the metadata and descriptions provided in the model's definition, if any.
Keywords
loess: Add a loess fit line to the plot. Default istrue.ols: Add an OLS fit line to the plot. Default istrue.observations: The observations to be plotted. When not specified then all observations for the given model will be shown. A subset of observations can be plotted by providing aSymbolorVector{Symbol}of observation names.paginate: (defaultfalse) Whentruesets the return type of a plot to aVector{Makie.Figure}rather thanMakie.Figurewhich splits the returned plot over several "pages" if there are too many to fit on a single figure comfortably. See also thelimitkeyword which can be used to set the limit of figures per page.limit: Sets the maximum number of axes that can be plotted per page when pagination is active.rows: Sets the maximum number of rows of subplots to be displayed on each paginatedMakie.Figurewhen pagination is active.columns: Sets the maximum number of columns of subplots to be displayed on each paginatedMakie.Figurewhen pagination is active.axis: A key-value object with axis options that gets passed to the underlyingAlgebraOfGraphics.drawcall.figure: A key-value object with figure options that gets passed to the underlyingAlgebraOfGraphics.drawcall. (Does not apply when plotting into an existing figure.)legend: A key-value object with legend options that gets passed to the underlyingAlgebraOfGraphics.drawcall. (Does not apply when plotting into an existing figure.) A legend will be drawn automatically unlesslegend = (; show = false)is set.facet: A key-value object with facet options that gets passed to the underlyingAlgebraOfGraphics.drawcall.colorbar: A key-value object with colorbar options that gets passed to the underlyingAlgebraOfGraphics.drawcall. (Does not apply when plotting into an existing figure.)
Supported Style Keywords
loess_colorloess_linestyleloess_linewidthols_colorols_linestyleols_linewidthmarkermarkercolormarkersize
For the fitted_model_inspection variable above the following syntax is used to generate the plot below:
goodness_of_fit(fitted_model_inspection)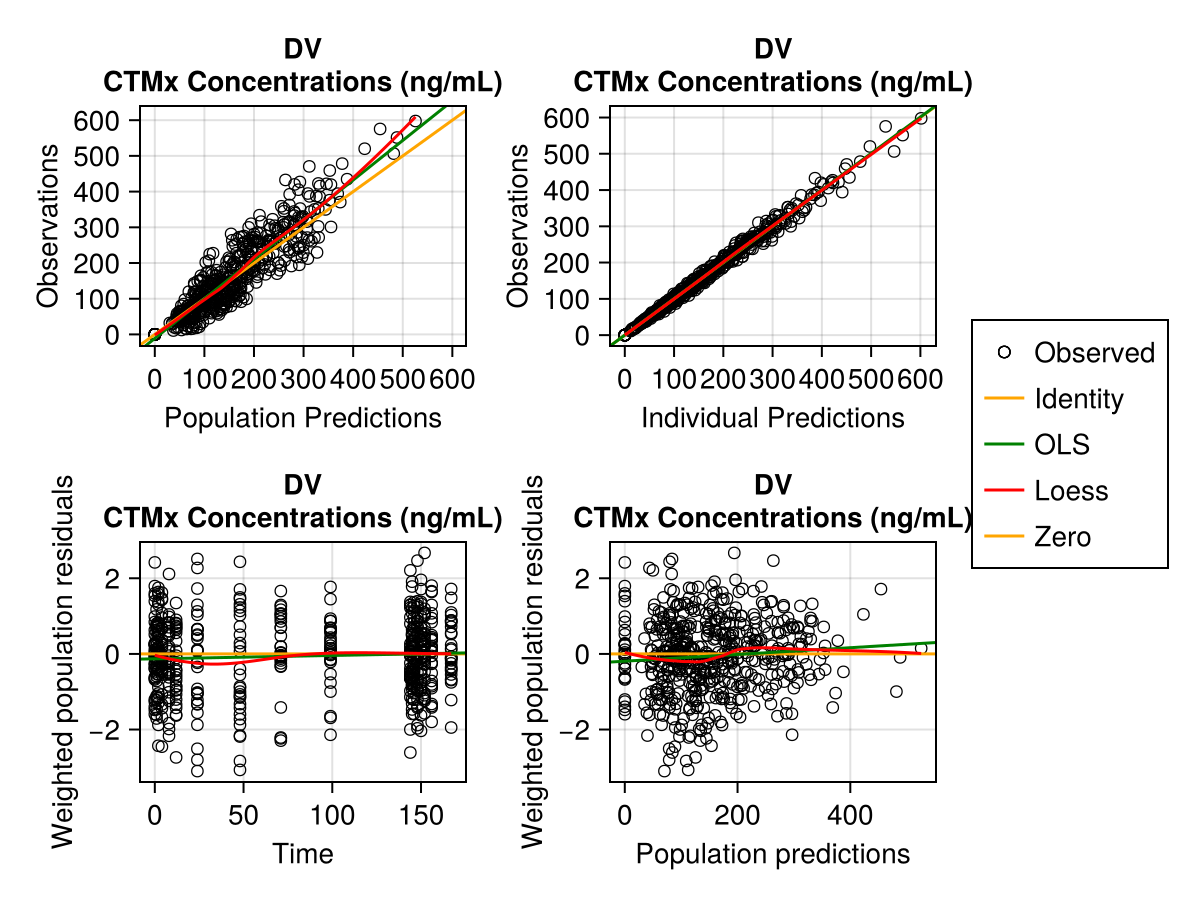
iwresiduals_vs_ipredictions
PumasPlots.iwresiduals_vs_ipredictions — Function
iwresiduals_vs_ipredictions(inspect | [model], wresiduals, predict)
iwresiduals_vs_ipredictions(figpos, inspect | [model], wresiduals, predict)
Plot the weighted individual residuals versus individual predictions for the given inspect object, or the combination of an optional model and the results of wresiduals and predict.
Axis label will be based on the metadata and descriptions provided in the model's definition, if any.
Keywords
loess: Add a loess fit line to the plot. Default istrue.ols: Add an OLS fit line to the plot. Default istrue.observations: The observations to be plotted. When not specified then all observations for the given model will be shown. A subset of observations can be plotted by providing aSymbolorVector{Symbol}of observation names.zeroline: Include a zeroline in the plot. Default istrue.labels: The custom name to use for each individual series within in the plot such as a scatter or line. Provide aNamedTuplewith any of the following keys and your custom label string:loess,ols, andobserved.paginate: (defaultfalse) Whentruesets the return type of a plot to aVector{Makie.Figure}rather thanMakie.Figurewhich splits the returned plot over several "pages" if there are too many to fit on a single figure comfortably. See also thelimitkeyword which can be used to set the limit of figures per page.limit: Sets the maximum number of axes that can be plotted per page when pagination is active.rows: Sets the maximum number of rows of subplots to be displayed on each paginatedMakie.Figurewhen pagination is active.columns: Sets the maximum number of columns of subplots to be displayed on each paginatedMakie.Figurewhen pagination is active.axis: A key-value object with axis options that gets passed to the underlyingAlgebraOfGraphics.drawcall.figure: A key-value object with figure options that gets passed to the underlyingAlgebraOfGraphics.drawcall. (Does not apply when plotting into an existing figure.)legend: A key-value object with legend options that gets passed to the underlyingAlgebraOfGraphics.drawcall. (Does not apply when plotting into an existing figure.) A legend will be drawn automatically unlesslegend = (; show = false)is set.facet: A key-value object with facet options that gets passed to the underlyingAlgebraOfGraphics.drawcall.colorbar: A key-value object with colorbar options that gets passed to the underlyingAlgebraOfGraphics.drawcall. (Does not apply when plotting into an existing figure.)
Supported Style Keywords
loess_colorloess_linestyleloess_linewidthols_colorols_linestyleols_linewidthzeroline_colorzeroline_linestylezeroline_linewidthmarkermarkercolormarkersize
For the fitted_model_inspection variable above the following syntax is used to generate the plot below:
iwresiduals_vs_ipredictions(fitted_model_inspection)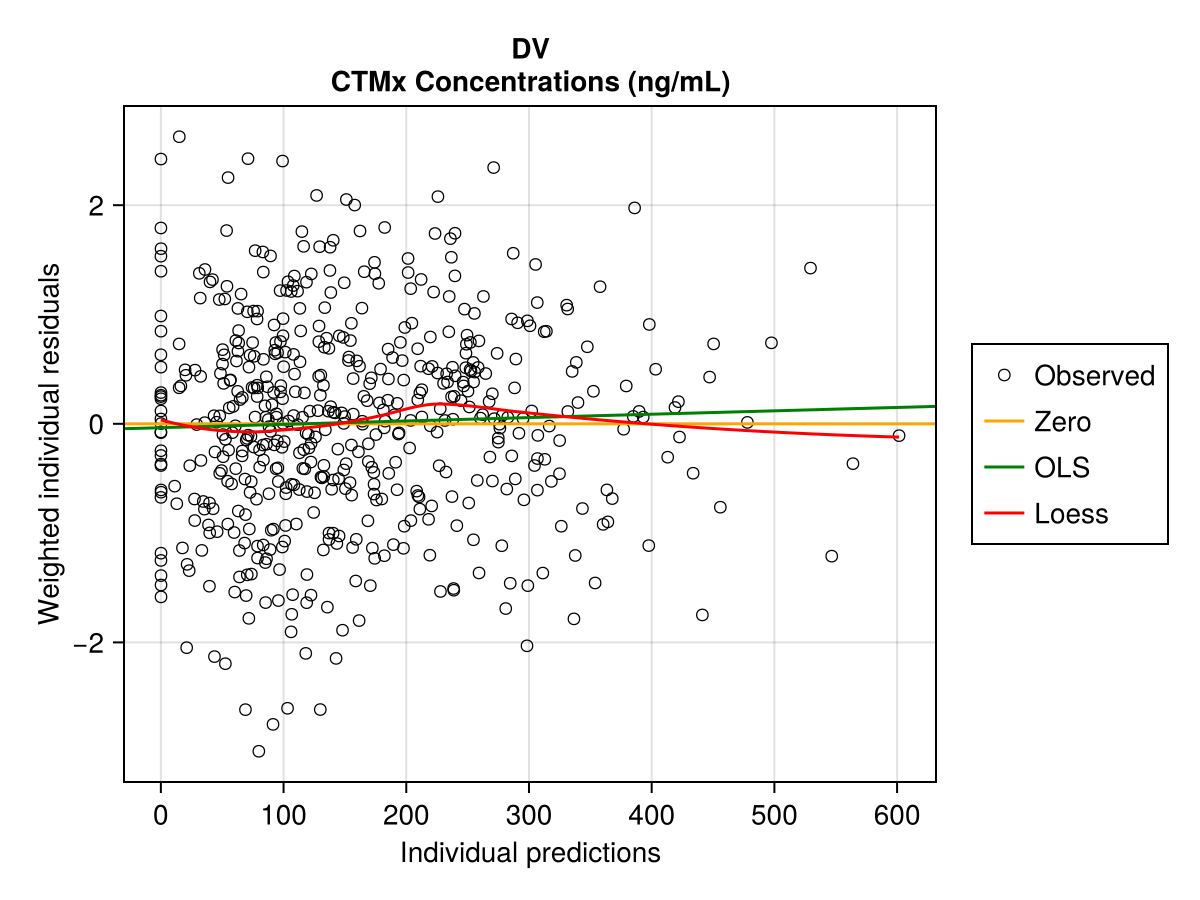
iwresiduals_vs_time
PumasPlots.iwresiduals_vs_time — Function
iwresiduals_vs_time(inspect | [model], wresiduals)
iwresiduals_vs_time(figpos, inspect | [model], wresiduals)
Plot the weighted individual residuals versus time for the given inspect object, or the combination of an optional model and the result of wresiduals.
Axis label will be based on the metadata and descriptions provided in the model's definition, if any.
Keywords
loess: Add a loess fit line to the plot. Default istrue.ols: Add an OLS fit line to the plot. Default istrue.observations: The observations to be plotted. When not specified then all observations for the given model will be shown. A subset of observations can be plotted by providing aSymbolorVector{Symbol}of observation names.zeroline: Include a zeroline in the plot. Default istrue.labels: The custom name to use for each individual series within in the plot such as a scatter or line. Provide aNamedTuplewith any of the following keys and your custom label string:loess,ols, andobserved.paginate: (defaultfalse) Whentruesets the return type of a plot to aVector{Makie.Figure}rather thanMakie.Figurewhich splits the returned plot over several "pages" if there are too many to fit on a single figure comfortably. See also thelimitkeyword which can be used to set the limit of figures per page.limit: Sets the maximum number of axes that can be plotted per page when pagination is active.rows: Sets the maximum number of rows of subplots to be displayed on each paginatedMakie.Figurewhen pagination is active.columns: Sets the maximum number of columns of subplots to be displayed on each paginatedMakie.Figurewhen pagination is active.axis: A key-value object with axis options that gets passed to the underlyingAlgebraOfGraphics.drawcall.figure: A key-value object with figure options that gets passed to the underlyingAlgebraOfGraphics.drawcall. (Does not apply when plotting into an existing figure.)legend: A key-value object with legend options that gets passed to the underlyingAlgebraOfGraphics.drawcall. (Does not apply when plotting into an existing figure.) A legend will be drawn automatically unlesslegend = (; show = false)is set.facet: A key-value object with facet options that gets passed to the underlyingAlgebraOfGraphics.drawcall.colorbar: A key-value object with colorbar options that gets passed to the underlyingAlgebraOfGraphics.drawcall. (Does not apply when plotting into an existing figure.)
Supported Style Keywords
loess_colorloess_linestyleloess_linewidthols_colorols_linestyleols_linewidthzeroline_colorzeroline_linestylezeroline_linewidthmarkermarkercolormarkersize
For the fitted_model_inspection variable above the following syntax is used to generate the plot below:
iwresiduals_vs_time(fitted_model_inspection)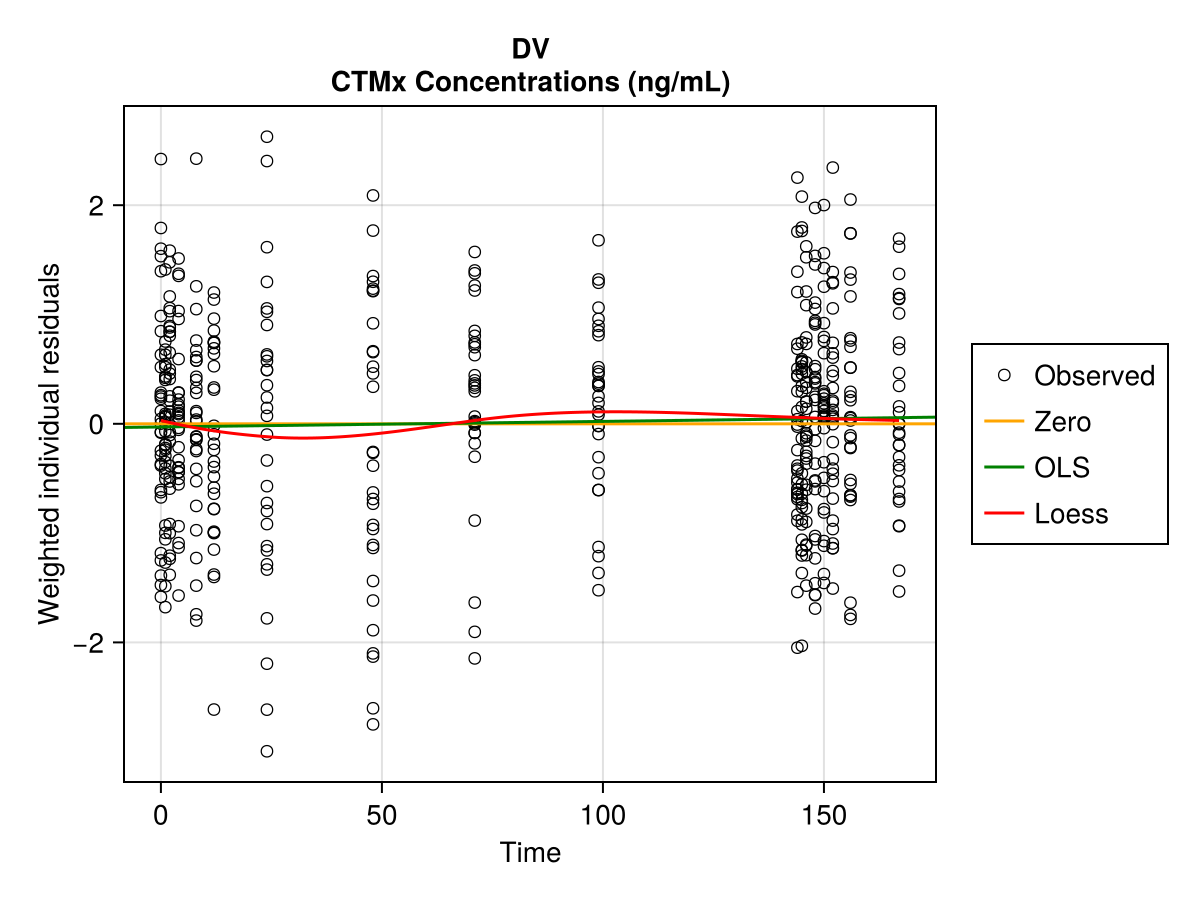
npde_dist
PumasPlots.npde_dist — Function
npde_dist(inspect)
npde_dist(figpos, inspect)
Keywords
observations: The observations to be plotted. When not specified then all observations for the given model will be shown. A subset of observations can be plotted by providing aSymbolorVector{Symbol}of observation names.zeroline: Include a zeroline in the plot. Default istrue.paginate: (defaultfalse) Whentruesets the return type of a plot to aVector{Makie.Figure}rather thanMakie.Figurewhich splits the returned plot over several "pages" if there are too many to fit on a single figure comfortably. See also thelimitkeyword which can be used to set the limit of figures per page.limit: Sets the maximum number of axes that can be plotted per page when pagination is active.rows: Sets the maximum number of rows of subplots to be displayed on each paginatedMakie.Figurewhen pagination is active.columns: Sets the maximum number of columns of subplots to be displayed on each paginatedMakie.Figurewhen pagination is active.axis: A key-value object with axis options that gets passed to the underlyingAlgebraOfGraphics.drawcall.figure: A key-value object with figure options that gets passed to the underlyingAlgebraOfGraphics.drawcall. (Does not apply when plotting into an existing figure.)legend: A key-value object with legend options that gets passed to the underlyingAlgebraOfGraphics.drawcall. (Does not apply when plotting into an existing figure.) A legend will be drawn automatically unlesslegend = (; show = false)is set.facet: A key-value object with facet options that gets passed to the underlyingAlgebraOfGraphics.drawcall.colorbar: A key-value object with colorbar options that gets passed to the underlyingAlgebraOfGraphics.drawcall. (Does not apply when plotting into an existing figure.)
Supported Style Keywords
colorstrokecolorstrokewidthzeroline_colorzeroline_linestylezeroline_linewidth
For the fitted_model_inspection_npde variable above the following syntax is used to generate the plot below:
npde_dist(fitted_model_inspection_npde)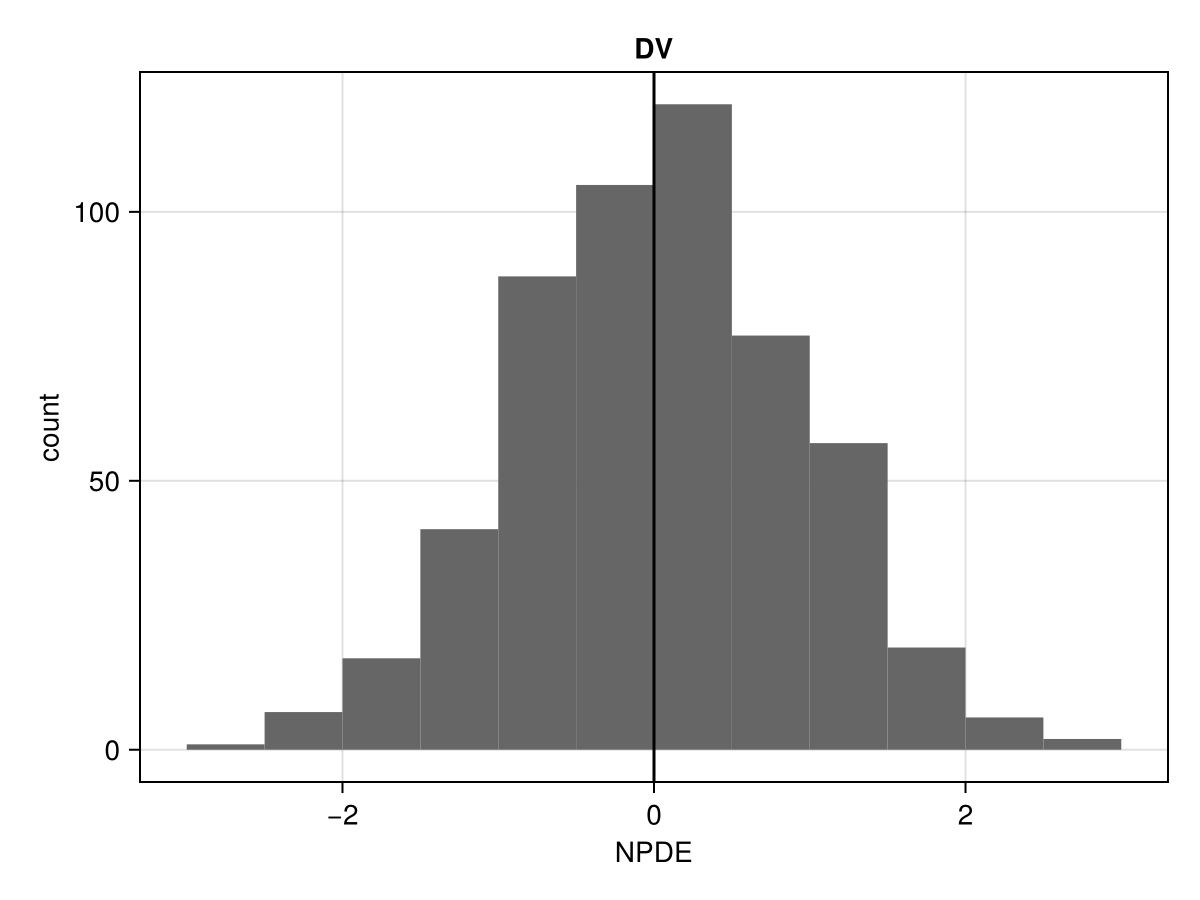
npde_vs_covariates
PumasPlots.npde_vs_covariates — Function
npde_vs_covariates(inspect)
npde_vs_covariates(figpos, inspect)
Keywords
categorical: Select which of the variables should be interpreted as categorical. Provide a vector of symbols corresponding to the names of the categorical variables. By default all variables are treated as continuous.covariates: The covariates to be plotted. When not specified then all covariates for the given model will be shown. A subset of covariates can be plotted by providing aSymbolorVector{Symbol}of covariate names.observations: The observations to be plotted. When not specified then all observations for the given model will be shown. A subset of observations can be plotted by providing aSymbolorVector{Symbol}of observation names.zeroline: Include a zeroline in the plot. Default istrue.paginate: (defaultfalse) Whentruesets the return type of a plot to aVector{Makie.Figure}rather thanMakie.Figurewhich splits the returned plot over several "pages" if there are too many to fit on a single figure comfortably. See also thelimitkeyword which can be used to set the limit of figures per page.limit: Sets the maximum number of axes that can be plotted per page when pagination is active.rows: Sets the maximum number of rows of subplots to be displayed on each paginatedMakie.Figurewhen pagination is active.columns: Sets the maximum number of columns of subplots to be displayed on each paginatedMakie.Figurewhen pagination is active.axis: A key-value object with axis options that gets passed to the underlyingAlgebraOfGraphics.drawcall.figure: A key-value object with figure options that gets passed to the underlyingAlgebraOfGraphics.drawcall. (Does not apply when plotting into an existing figure.)legend: A key-value object with legend options that gets passed to the underlyingAlgebraOfGraphics.drawcall. (Does not apply when plotting into an existing figure.) A legend will be drawn automatically unlesslegend = (; show = false)is set.facet: A key-value object with facet options that gets passed to the underlyingAlgebraOfGraphics.drawcall.colorbar: A key-value object with colorbar options that gets passed to the underlyingAlgebraOfGraphics.drawcall. (Does not apply when plotting into an existing figure.)
Supported Style Keywords
colormarkermarkersizezeroline_colorzeroline_linestylezeroline_linewidth
For the fitted_model_inspection_npde variable above the following syntax is used to generate the plot below:
npde_vs_covariates(fitted_model_inspection_npde; categorical = [:SEX, :GROUP])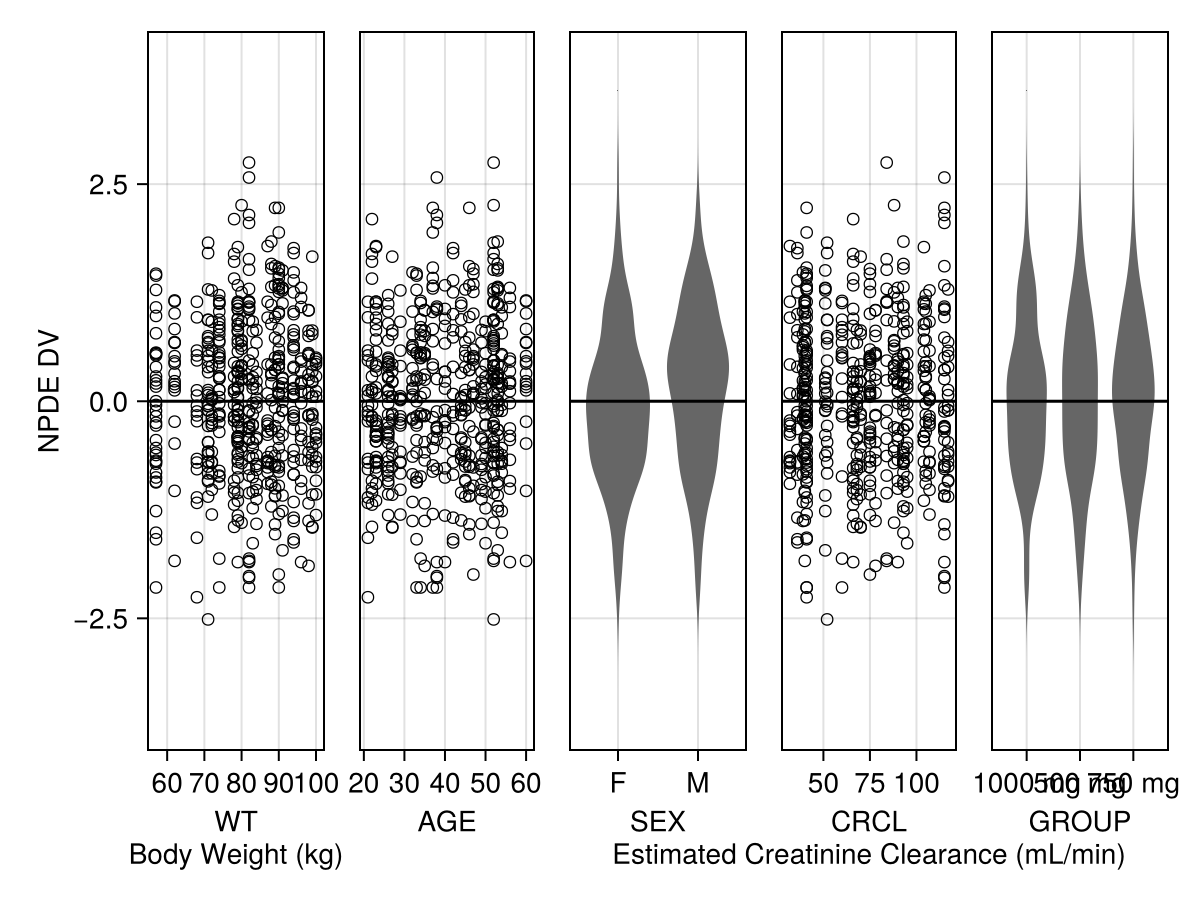
npde_vs_predictions
PumasPlots.npde_vs_predictions — Function
npde_vs_predictions(inspect)
npde_vs_predictions(figpos, inspect)
Keywords
loess: Add a loess fit line to the plot. Default istrue.ols: Add an OLS fit line to the plot. Default istrue.observations: The observations to be plotted. When not specified then all observations for the given model will be shown. A subset of observations can be plotted by providing aSymbolorVector{Symbol}of observation names.zeroline: Include a zeroline in the plot. Default istrue.labels: The custom name to use for each individual series within in the plot such as a scatter or line. Provide aNamedTuplewith any of the following keys and your custom label string:loess,ols, andobserved.paginate: (defaultfalse) Whentruesets the return type of a plot to aVector{Makie.Figure}rather thanMakie.Figurewhich splits the returned plot over several "pages" if there are too many to fit on a single figure comfortably. See also thelimitkeyword which can be used to set the limit of figures per page.limit: Sets the maximum number of axes that can be plotted per page when pagination is active.rows: Sets the maximum number of rows of subplots to be displayed on each paginatedMakie.Figurewhen pagination is active.columns: Sets the maximum number of columns of subplots to be displayed on each paginatedMakie.Figurewhen pagination is active.axis: A key-value object with axis options that gets passed to the underlyingAlgebraOfGraphics.drawcall.figure: A key-value object with figure options that gets passed to the underlyingAlgebraOfGraphics.drawcall. (Does not apply when plotting into an existing figure.)legend: A key-value object with legend options that gets passed to the underlyingAlgebraOfGraphics.drawcall. (Does not apply when plotting into an existing figure.) A legend will be drawn automatically unlesslegend = (; show = false)is set.facet: A key-value object with facet options that gets passed to the underlyingAlgebraOfGraphics.drawcall.colorbar: A key-value object with colorbar options that gets passed to the underlyingAlgebraOfGraphics.drawcall. (Does not apply when plotting into an existing figure.)
Supported Style Keywords
loess_colorloess_linestyleloess_linewidthols_colorols_linestyleols_linewidthzeroline_colorzeroline_linestylezeroline_linewidthmarkermarkercolormarkersize
For the fitted_model_inspection_npde variable above the following syntax is used to generate the plot below:
npde_vs_predictions(fitted_model_inspection_npde)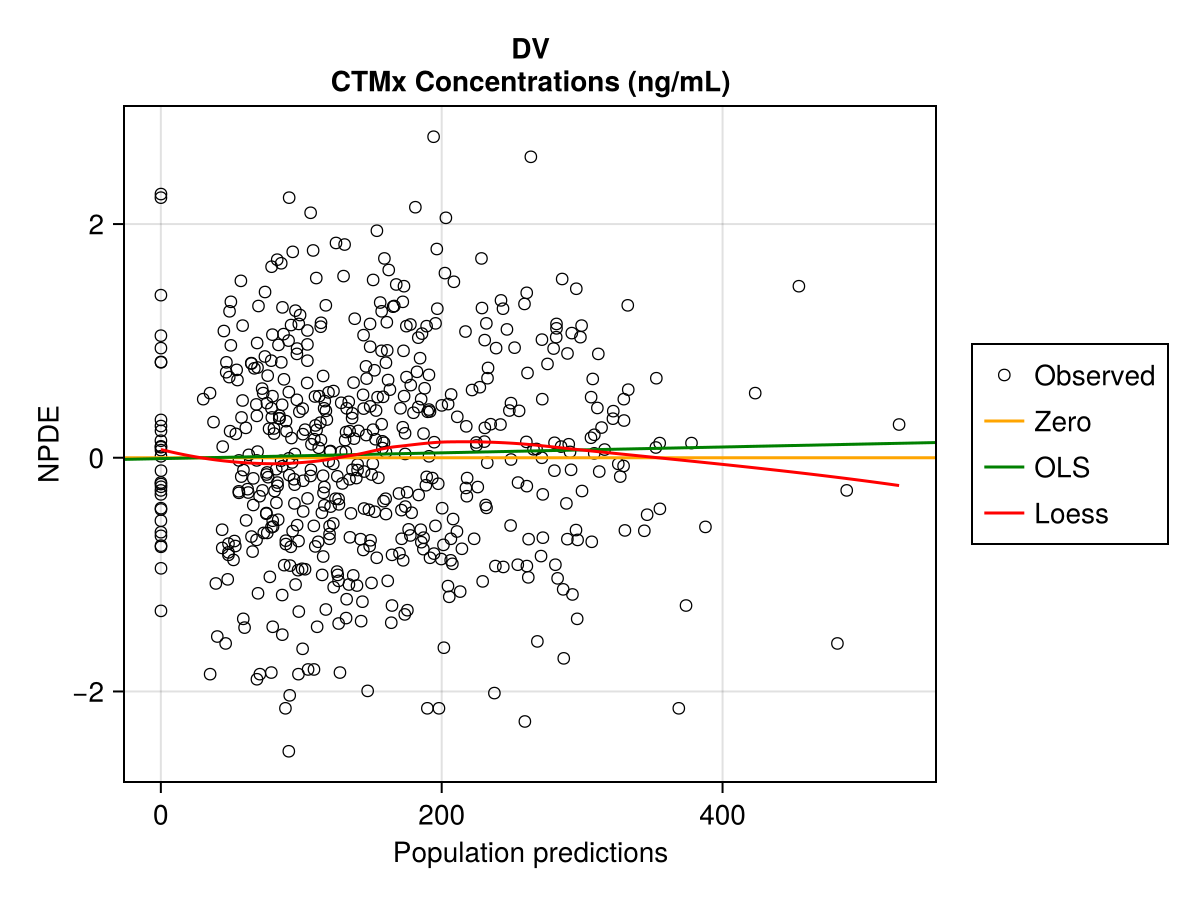
npde_vs_time
PumasPlots.npde_vs_time — Function
npde_vs_time(inspect)
npde_vs_time(figpos, inspect)
Keywords
loess: Add a loess fit line to the plot. Default istrue.ols: Add an OLS fit line to the plot. Default istrue.observations: The observations to be plotted. When not specified then all observations for the given model will be shown. A subset of observations can be plotted by providing aSymbolorVector{Symbol}of observation names.zeroline: Include a zeroline in the plot. Default istrue.labels: The custom name to use for each individual series within in the plot such as a scatter or line. Provide aNamedTuplewith any of the following keys and your custom label string:loess,ols, andobserved.paginate: (defaultfalse) Whentruesets the return type of a plot to aVector{Makie.Figure}rather thanMakie.Figurewhich splits the returned plot over several "pages" if there are too many to fit on a single figure comfortably. See also thelimitkeyword which can be used to set the limit of figures per page.limit: Sets the maximum number of axes that can be plotted per page when pagination is active.rows: Sets the maximum number of rows of subplots to be displayed on each paginatedMakie.Figurewhen pagination is active.columns: Sets the maximum number of columns of subplots to be displayed on each paginatedMakie.Figurewhen pagination is active.axis: A key-value object with axis options that gets passed to the underlyingAlgebraOfGraphics.drawcall.figure: A key-value object with figure options that gets passed to the underlyingAlgebraOfGraphics.drawcall. (Does not apply when plotting into an existing figure.)legend: A key-value object with legend options that gets passed to the underlyingAlgebraOfGraphics.drawcall. (Does not apply when plotting into an existing figure.) A legend will be drawn automatically unlesslegend = (; show = false)is set.facet: A key-value object with facet options that gets passed to the underlyingAlgebraOfGraphics.drawcall.colorbar: A key-value object with colorbar options that gets passed to the underlyingAlgebraOfGraphics.drawcall. (Does not apply when plotting into an existing figure.)
Supported Style Keywords
loess_colorloess_linestyleloess_linewidthols_colorols_linestyleols_linewidthzeroline_colorzeroline_linestylezeroline_linewidthmarkermarkercolormarkersize
For the fitted_model_inspection_npde variable above the following syntax is used to generate the plot below:
npde_vs_time(fitted_model_inspection_npde)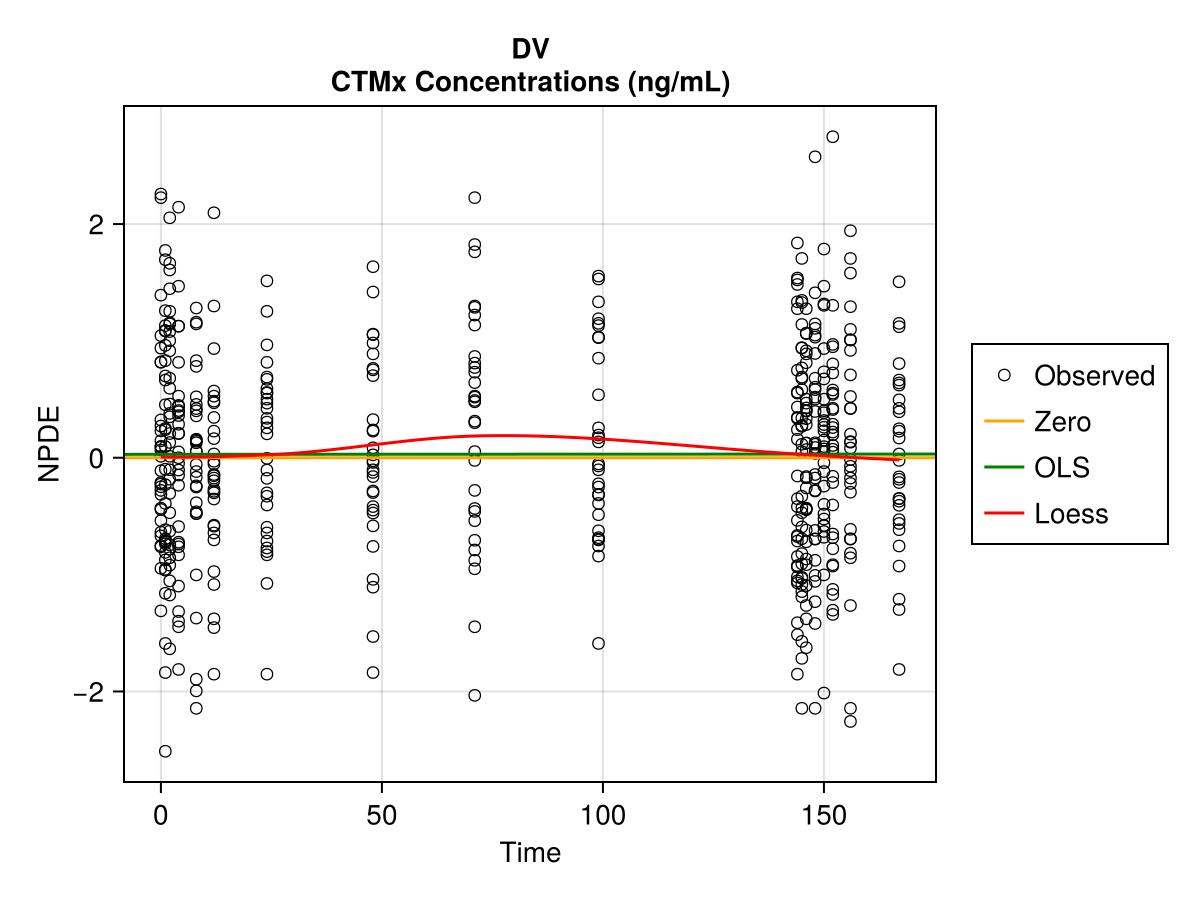
observations_vs_ipredictions
PumasPlots.observations_vs_ipredictions — Function
observations_vs_ipredictions(inspect | [model], predict)
observations_vs_ipredictions(figpos, inspect | [model], predict)
Plot observations versus individual predictions for the given inspect object, or the combination of an optional model and the results of predict.
Axis label will be based on the metadata and descriptions provided in the model's definition, if any.
Keywords
identity: Add an identity line to the plot. Default istrue.loess: Add a loess fit line to the plot. Default istrue.ols: Add an OLS fit line to the plot. Default istrue.observations: The observations to be plotted. When not specified then all observations for the given model will be shown. A subset of observations can be plotted by providing aSymbolorVector{Symbol}of observation names.labels: The custom name to use for each individual series within in the plot such as a scatter or line. Provide aNamedTuplewith any of the following keys and your custom label string:identity,loess,ols, andobserved.paginate: (defaultfalse) Whentruesets the return type of a plot to aVector{Makie.Figure}rather thanMakie.Figurewhich splits the returned plot over several "pages" if there are too many to fit on a single figure comfortably. See also thelimitkeyword which can be used to set the limit of figures per page.limit: Sets the maximum number of axes that can be plotted per page when pagination is active.rows: Sets the maximum number of rows of subplots to be displayed on each paginatedMakie.Figurewhen pagination is active.columns: Sets the maximum number of columns of subplots to be displayed on each paginatedMakie.Figurewhen pagination is active.axis: A key-value object with axis options that gets passed to the underlyingAlgebraOfGraphics.drawcall.figure: A key-value object with figure options that gets passed to the underlyingAlgebraOfGraphics.drawcall. (Does not apply when plotting into an existing figure.)legend: A key-value object with legend options that gets passed to the underlyingAlgebraOfGraphics.drawcall. (Does not apply when plotting into an existing figure.) A legend will be drawn automatically unlesslegend = (; show = false)is set.facet: A key-value object with facet options that gets passed to the underlyingAlgebraOfGraphics.drawcall.colorbar: A key-value object with colorbar options that gets passed to the underlyingAlgebraOfGraphics.drawcall. (Does not apply when plotting into an existing figure.)
Supported Style Keywords
identity_coloridentity_linewidthidentity_linestyleloess_colorloess_linestyleloess_linewidthols_colorols_linestyleols_linewidthmarkermarkercolormarkersize
For the fitted_model_inspection variable above the following syntax is used to generate the plot below:
observations_vs_ipredictions(fitted_model_inspection)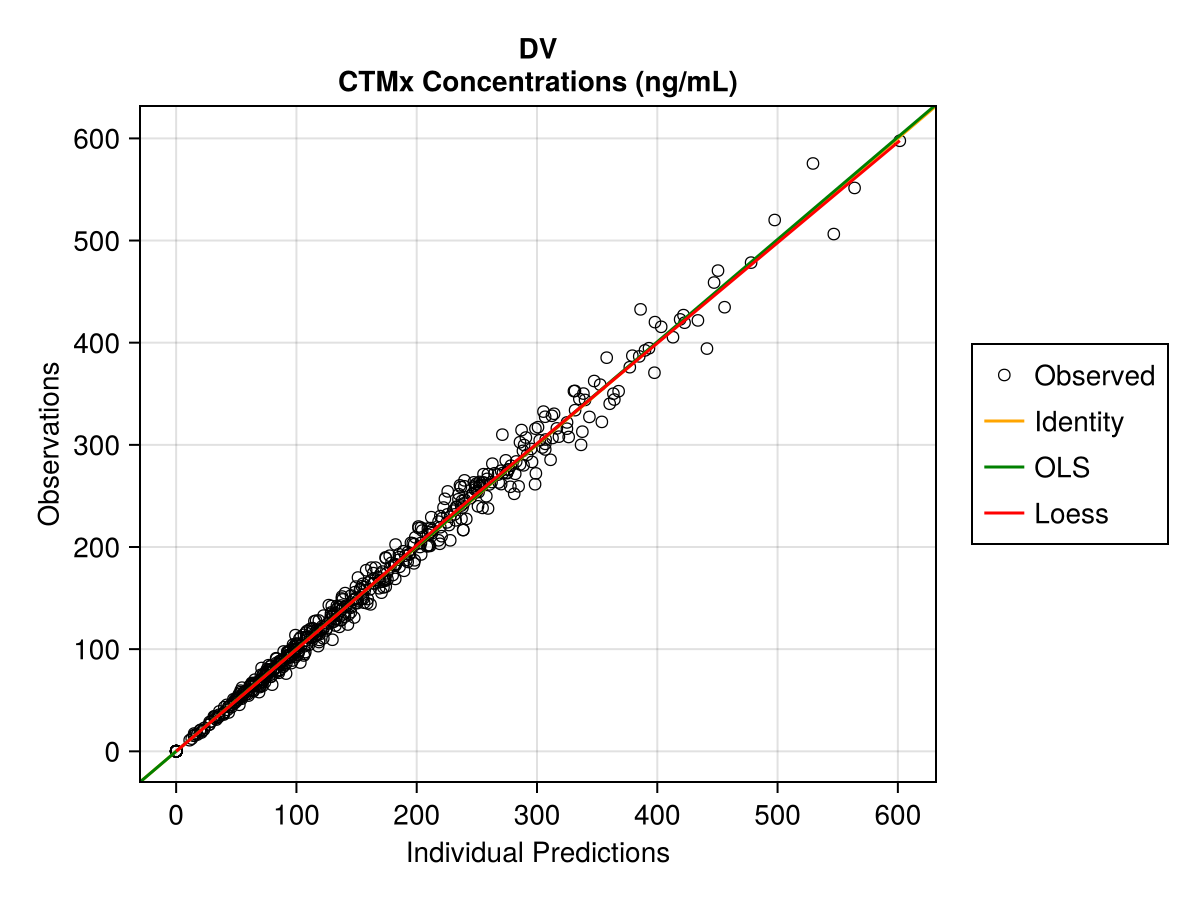
observations_vs_predictions
PumasPlots.observations_vs_predictions — Function
observations_vs_predictions(inspect | [model], predict)
observations_vs_predictions(figpos, inspect | [model], predict)
Plot observations versus population predictions for the given inspect object, or the combination of an optional model and the results of predict.
Axis label will be based on the metadata and descriptions provided in the model's definition, if any.
Keywords
identity: Add an identity line to the plot. Default istrue.loess: Add a loess fit line to the plot. Default istrue.ols: Add an OLS fit line to the plot. Default istrue.observations: The observations to be plotted. When not specified then all observations for the given model will be shown. A subset of observations can be plotted by providing aSymbolorVector{Symbol}of observation names.labels: The custom name to use for each individual series within in the plot such as a scatter or line. Provide aNamedTuplewith any of the following keys and your custom label string:identity,loess,ols, andobserved.paginate: (defaultfalse) Whentruesets the return type of a plot to aVector{Makie.Figure}rather thanMakie.Figurewhich splits the returned plot over several "pages" if there are too many to fit on a single figure comfortably. See also thelimitkeyword which can be used to set the limit of figures per page.limit: Sets the maximum number of axes that can be plotted per page when pagination is active.rows: Sets the maximum number of rows of subplots to be displayed on each paginatedMakie.Figurewhen pagination is active.columns: Sets the maximum number of columns of subplots to be displayed on each paginatedMakie.Figurewhen pagination is active.axis: A key-value object with axis options that gets passed to the underlyingAlgebraOfGraphics.drawcall.figure: A key-value object with figure options that gets passed to the underlyingAlgebraOfGraphics.drawcall. (Does not apply when plotting into an existing figure.)legend: A key-value object with legend options that gets passed to the underlyingAlgebraOfGraphics.drawcall. (Does not apply when plotting into an existing figure.) A legend will be drawn automatically unlesslegend = (; show = false)is set.facet: A key-value object with facet options that gets passed to the underlyingAlgebraOfGraphics.drawcall.colorbar: A key-value object with colorbar options that gets passed to the underlyingAlgebraOfGraphics.drawcall. (Does not apply when plotting into an existing figure.)
Supported Style Keywords
identity_coloridentity_linewidthidentity_linestyleloess_colorloess_linestyleloess_linewidthols_colorols_linestyleols_linewidthmarkermarkercolormarkersize
For the fitted_model_inspection variable above the following syntax is used to generate the plot below:
observations_vs_predictions(fitted_model_inspection)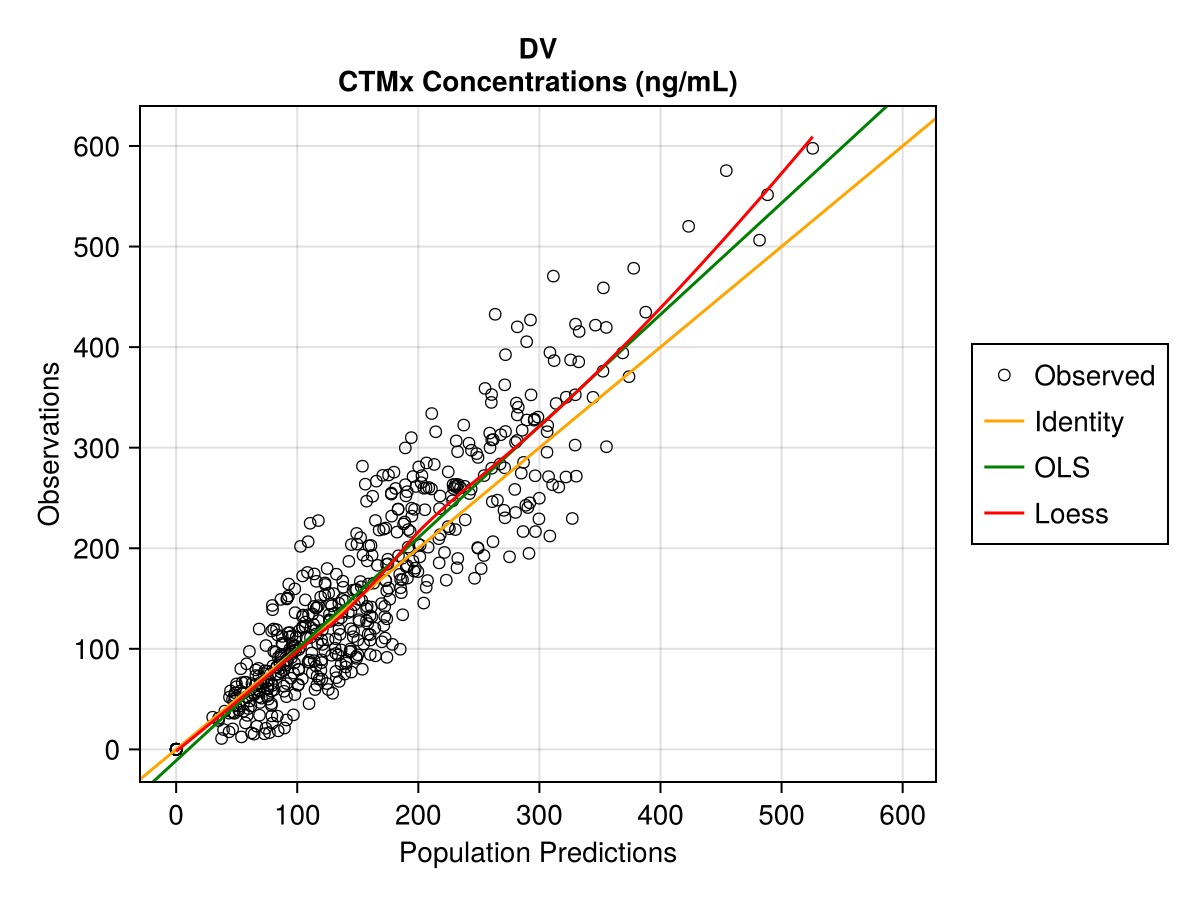
observations_vs_time
PlottingUtilities.observations_vs_time — Method
observations_vs_time([model,] subject | population | fit | inspect)
observations_vs_time(figpos, [model,] subject | population | fit | inspect)
Plot observations versus time profiles for the given population. Optionally the associated model can be given as the first argument which can provide more detailed axis labels based on the descriptions and metadata from the model's definition. A single fit or inspect object can be passed in instead of providing the model and population pair.
Keywords
loess: Add a loess fit line to the plot. Default istrue.observations: The observations to be plotted. When not specified then all observations for the given model will be shown. A subset of observations can be plotted by providing aSymbolorVector{Symbol}of observation names.separate: Choose whether to overlay all plots or place each in a separate subplot.labels: The custom name to use for each individual series within in the plot such as a scatter or line. Provide aNamedTuplewith any of the following keys and your custom label string:observed, andloess.paginate: (defaultfalse) Whentruesets the return type of a plot to aVector{Makie.Figure}rather thanMakie.Figurewhich splits the returned plot over several "pages" if there are too many to fit on a single figure comfortably. See also thelimitkeyword which can be used to set the limit of figures per page.limit: Sets the maximum number of axes that can be plotted per page when pagination is active.rows: Sets the maximum number of rows of subplots to be displayed on each paginatedMakie.Figurewhen pagination is active.columns: Sets the maximum number of columns of subplots to be displayed on each paginatedMakie.Figurewhen pagination is active.axis: A key-value object with axis options that gets passed to the underlyingAlgebraOfGraphics.drawcall.figure: A key-value object with figure options that gets passed to the underlyingAlgebraOfGraphics.drawcall. (Does not apply when plotting into an existing figure.)legend: A key-value object with legend options that gets passed to the underlyingAlgebraOfGraphics.drawcall. (Does not apply when plotting into an existing figure.) A legend will be drawn automatically unlesslegend = (; show = false)is set.facet: A key-value object with facet options that gets passed to the underlyingAlgebraOfGraphics.drawcall.colorbar: A key-value object with colorbar options that gets passed to the underlyingAlgebraOfGraphics.drawcall. (Does not apply when plotting into an existing figure.)
Supported Style Keywords
colorlinewidthlinestylemarkermarkercolormarkersizeloess_colorloess_linestyleloess_linewidth
For the fitted_model_inspection variable above the following syntax is used to generate the plot below:
observations_vs_time(fitted_model_inspection)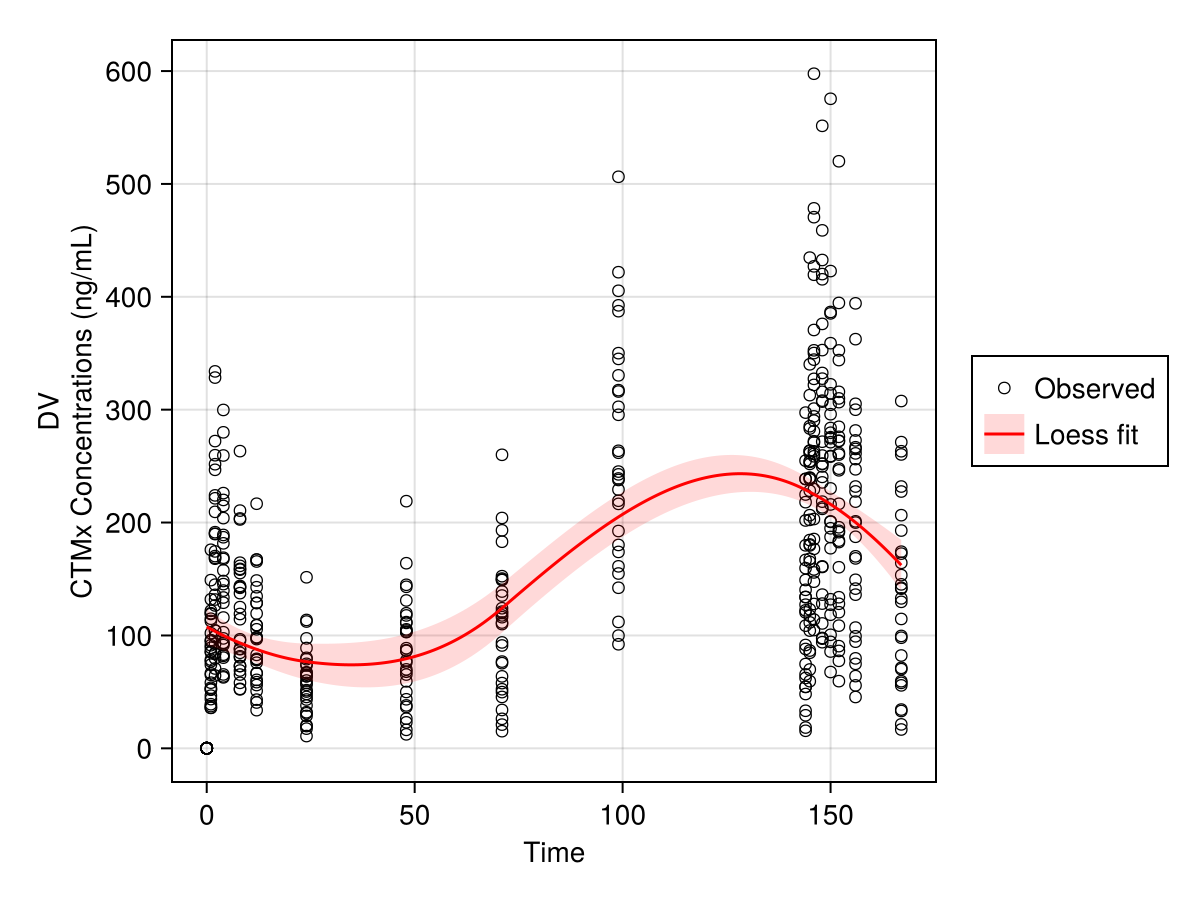
sim_plot
PumasPlots.sim_plot — Function
sim_plot([model,] simobs)
sim_plot(figpos, [model,] simobs)
Plot simulated model predictions from the result of a simobs call. The model used to simulate may optionally be passed to sim_plot, which is used to provide improved axis labels.
Keywords
ids: Select which subject IDs to display. Can be either a single ID or aVectorof IDs. Note that the type of the ID must match those in the population, i.e. a value1is not the same as a"1".separate: Choose whether to overlay all plots or place each in a separate subplot.observations: The observations to be plotted. When not specified then all observations for the given model will be shown. A subset of observations can be plotted by providing aSymbolorVector{Symbol}of observation names.labels: The custom name to use for each individual series within in the plot such as a scatter or line. Provide aNamedTuplewith any of the following keys and your custom label string:simulated, anddata.paginate: (defaultfalse) Whentruesets the return type of a plot to aVector{Makie.Figure}rather thanMakie.Figurewhich splits the returned plot over several "pages" if there are too many to fit on a single figure comfortably. See also thelimitkeyword which can be used to set the limit of figures per page.limit: Sets the maximum number of axes that can be plotted per page when pagination is active.rows: Sets the maximum number of rows of subplots to be displayed on each paginatedMakie.Figurewhen pagination is active.columns: Sets the maximum number of columns of subplots to be displayed on each paginatedMakie.Figurewhen pagination is active.axis: A key-value object with axis options that gets passed to the underlyingAlgebraOfGraphics.drawcall.figure: A key-value object with figure options that gets passed to the underlyingAlgebraOfGraphics.drawcall. (Does not apply when plotting into an existing figure.)legend: A key-value object with legend options that gets passed to the underlyingAlgebraOfGraphics.drawcall. (Does not apply when plotting into an existing figure.) A legend will be drawn automatically unlesslegend = (; show = false)is set.facet: A key-value object with facet options that gets passed to the underlyingAlgebraOfGraphics.drawcall.colorbar: A key-value object with colorbar options that gets passed to the underlyingAlgebraOfGraphics.drawcall. (Does not apply when plotting into an existing figure.)
Supported Style Keywords
colorlinestylelinewidthmarkermarkercolormarkersize
color and markercolor can both be set to the name of a gradient in which case each subject will use a different color based on partitioning the gradient into discrete colors. See Makie.available_gradients() for the full list of supported colors.
For the model and sim variables above the following syntax is used to generate the plot below:
sim_plot(model, sim)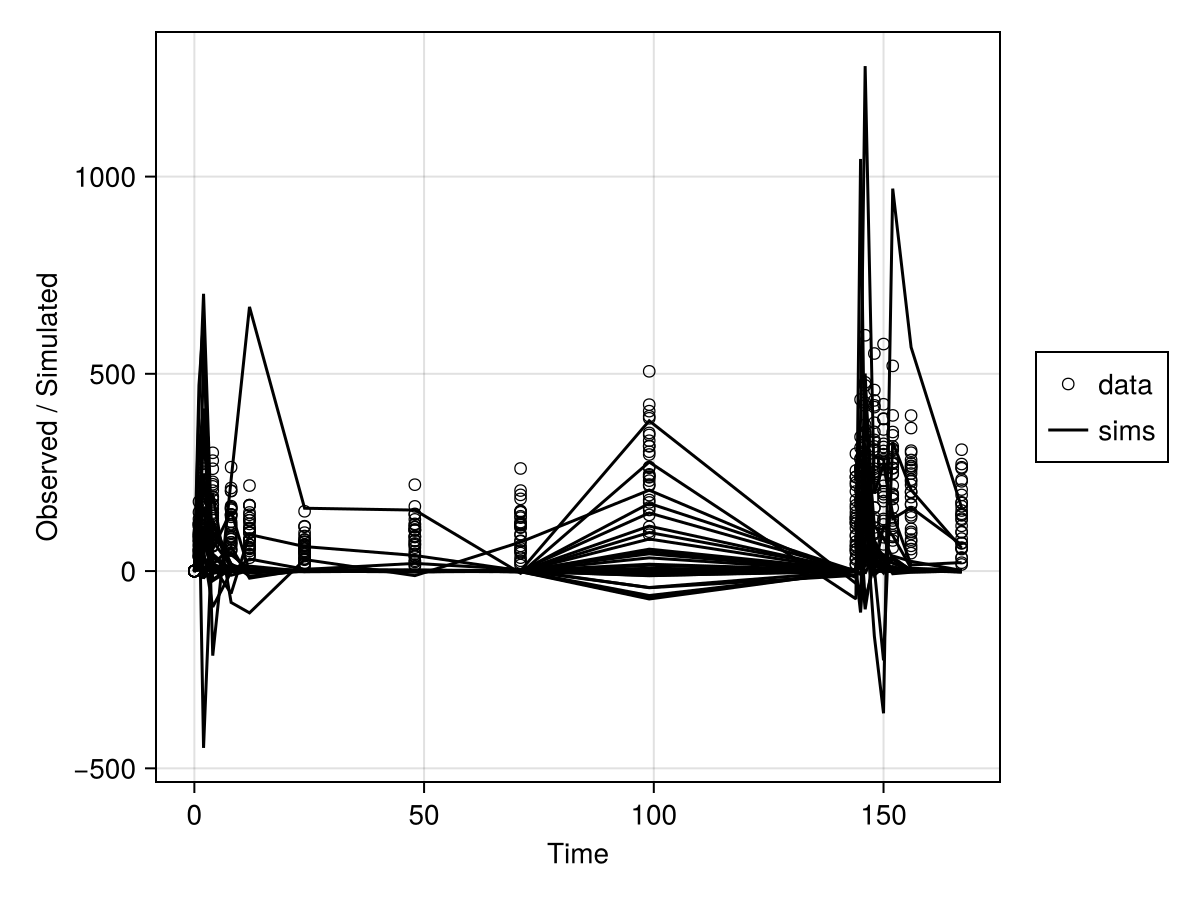
subject_fits
PlottingUtilities.subject_fits — Method
subject_fits(inspect | [model], predict)
subject_fits(figpos, inspect | [model], predict)
Plot the population and individual predictions overlaid over observations for the provided observations by ID and the given inspect object, or the combination of a model and the results of predict.
Keywords
ids: Select which subject IDs to display. Can be either a single ID or aVectorof IDs. Note that the type of the ID must match those in the population, i.e. a value1is not the same as a"1".observations: The observations to be plotted. When not specified then all observations for the given model will be shown. A subset of observations can be plotted by providing aSymbolorVector{Symbol}of observation names.separate: Choose whether to overlay all plots or place each in a separate subplot.labels: The custom name to use for each individual series within in the plot such as a scatter or line. Provide aNamedTuplewith any of the following keys and your custom label string:data,pred, andipred.paginate: (defaultfalse) Whentruesets the return type of a plot to aVector{Makie.Figure}rather thanMakie.Figurewhich splits the returned plot over several "pages" if there are too many to fit on a single figure comfortably. See also thelimitkeyword which can be used to set the limit of figures per page.limit: Sets the maximum number of axes that can be plotted per page when pagination is active.rows: Sets the maximum number of rows of subplots to be displayed on each paginatedMakie.Figurewhen pagination is active.columns: Sets the maximum number of columns of subplots to be displayed on each paginatedMakie.Figurewhen pagination is active.axis: A key-value object with axis options that gets passed to the underlyingAlgebraOfGraphics.drawcall.figure: A key-value object with figure options that gets passed to the underlyingAlgebraOfGraphics.drawcall. (Does not apply when plotting into an existing figure.)legend: A key-value object with legend options that gets passed to the underlyingAlgebraOfGraphics.drawcall. (Does not apply when plotting into an existing figure.) A legend will be drawn automatically unlesslegend = (; show = false)is set.facet: A key-value object with facet options that gets passed to the underlyingAlgebraOfGraphics.drawcall.colorbar: A key-value object with colorbar options that gets passed to the underlyingAlgebraOfGraphics.drawcall. (Does not apply when plotting into an existing figure.)
Supported Style Keywords
markermarkersizemarkercoloripred_coloripred_linewidthipred_linestylepred_colorpred_linewidthpred_linestyle
For the fitted_model_inspection variable above the following syntax is used to generate the plot below:
figures = subject_fits(fitted_model_inspection; separate = true, paginate = true)

figures[1]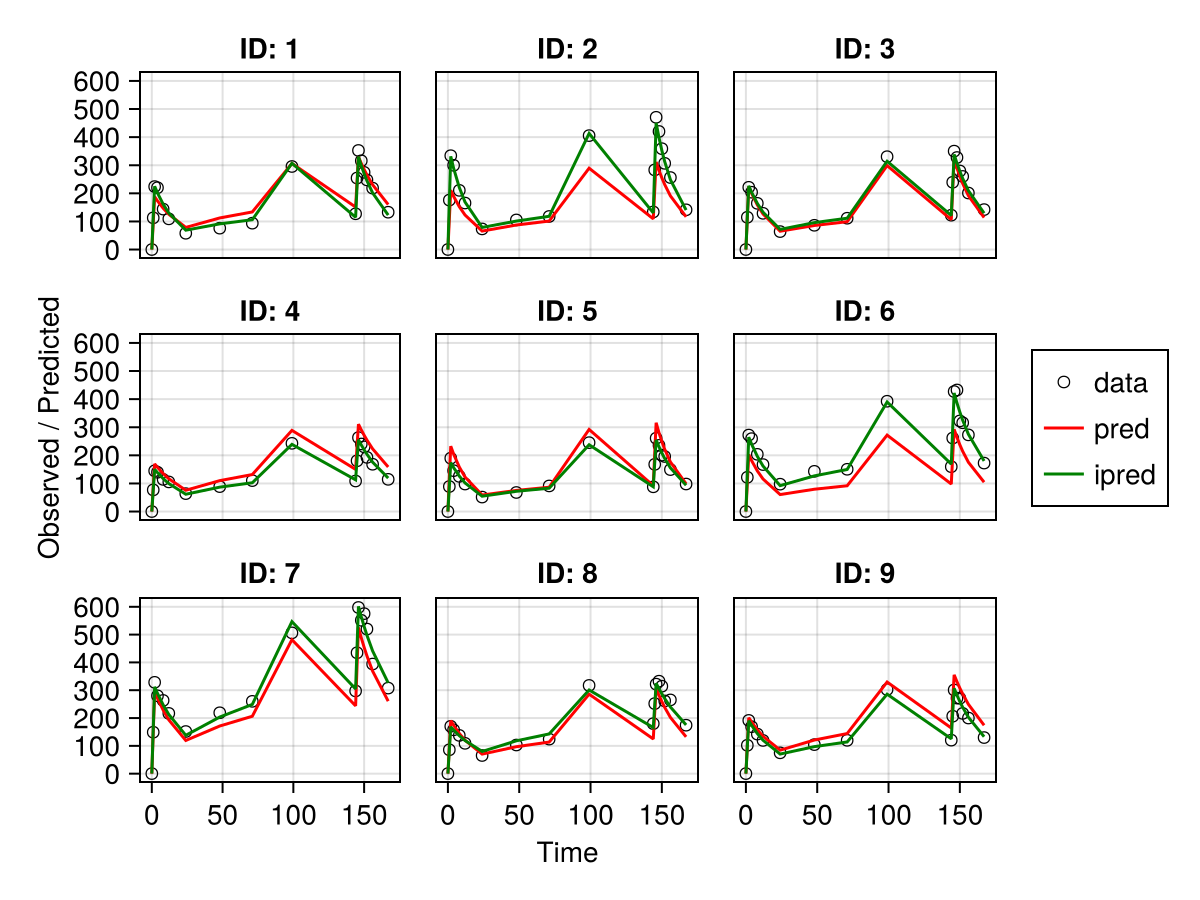
vpc_plot
PumasPlots.vpc_plot — Function
vpc_plot!(axis, [model,] vpc)
vpc_plot(figpos, [model,] vpc)
vpc_plot([model,] vpc)
Keywords
ci_bands::Boolshow confidence interval band.group::Tupleselect which stratification to display. A tuple ofPair{Symbol,Any}entries.levels::Union{String,Symbol,Vector}select which levels to display in discrete VPCs.observations::Booldisplay a scatter plot of the observations data.observed_ci::Boolshow the observed confidence interval band.observed_quantiles::Boolshow the observed quantiles band.simquantile_medians::Boolshow the simulated quantile median line.unit_yaxis::Boolset the limits of the y-axis to the unit range,[0, 1].censored::Symboleither:all(default),:continuous, or:discrete. Controls display of censored VPC pairs::allshows both stacked, others show only that component.paginate: (defaultfalse) Whentruesets the return type of a plot to aVector{Makie.Figure}rather thanMakie.Figurewhich splits the returned plot over several "pages" if there are too many to fit on a single figure comfortably. See also thelimitkeyword which can be used to set the limit of figures per page.limit: Sets the maximum number of axes that can be plotted per page when pagination is active.rows: Sets the maximum number of rows of subplots to be displayed on each paginatedMakie.Figurewhen pagination is active.columns: Sets the maximum number of columns of subplots to be displayed on each paginatedMakie.Figurewhen pagination is active.legend: Eithertrueor aNamedTupleof keyword arguments to pass to theaxislegendfunction for each createdMakie.Axisfor the plot.facet: Control the appearance of faceted plots. Off by default. Eithertrueto use default facet settings which hide decorations, ticks, and labels for subplots aside from the left column and bottom row, or aNamedTuplewith the followingBoolkeys:hidexlabels,hideylabels, andhidelabels. Defaulttrue. Hides labels that are not on the left or bottom edges.hidexticks,hideyticks, andhideticks. Defaulttrue. Hides ticks and tick labels that are not on the left or bottom edges.linkxaxes,linkyaxes, andlinkaxes. Defaulttrue. Links the limits of the axes along columns/rows.combinexlabels,combineylabels, andcombinelabels. Defaultfalse. Merges unique labels along the left and bottom edges.
labels: The custom name to use for each individual series within in the plot such as a scatter or line. Provide aNamedTuplewith any of the following keys and your custom label string:observed,simulated,observed_ci,simulated_ci, andoutliers.
Supported Style Keywords
outlier_colormarkermarkercolormarkersizeband_colorobserved_colorobserved_linewidthobserved_linestylesimulated_colorsimulated_linewidthsimulated_linestyle
Continuous VPCs
For the continuous_vpc variable above the following syntax is used to generate the plot below:
vpc_plot(model, continuous_vpc)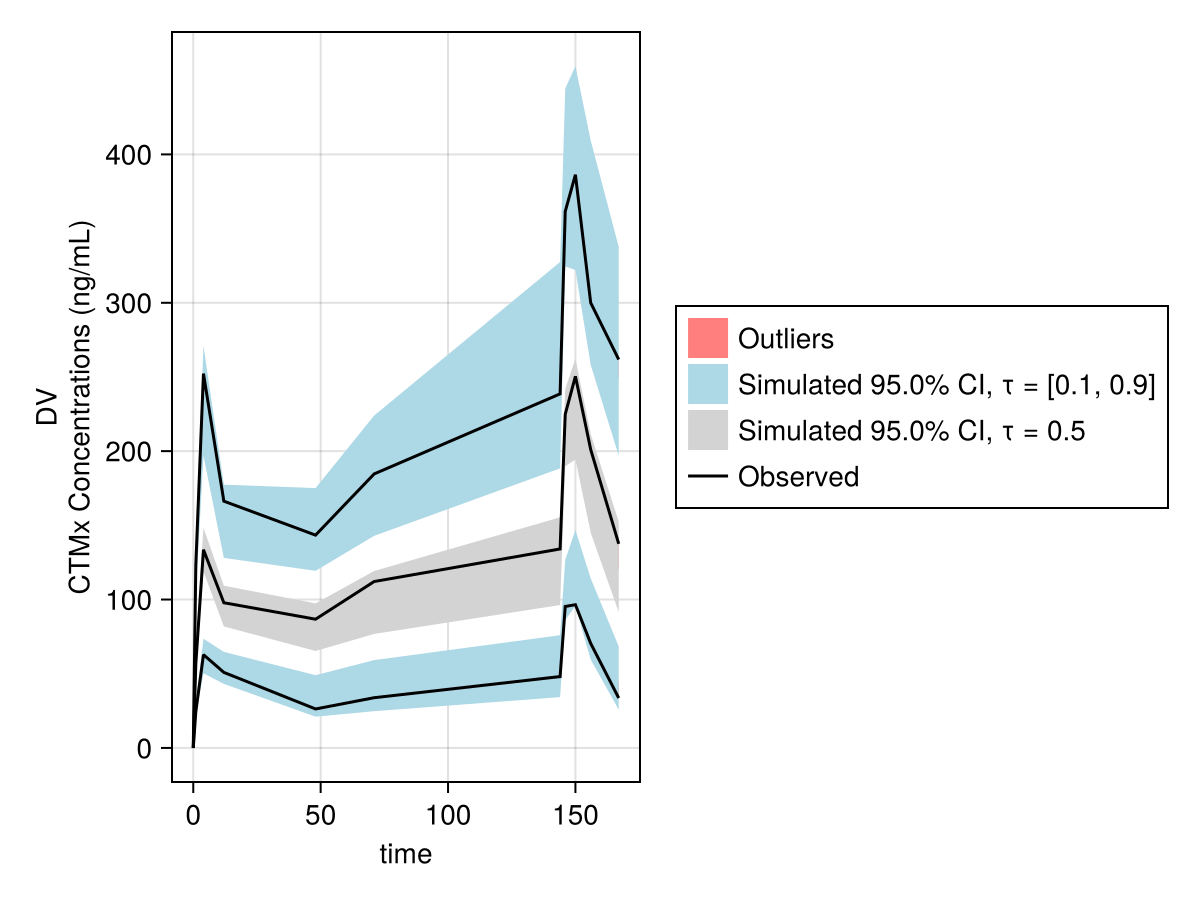
wresiduals_dist
PumasPlots.wresiduals_dist — Function
wresiduals_dist(inspect | [model], wresiduals)
wresiduals_dist(figpos, inspect | [model], wresiduals)
Plot the distribution of weighted residuals for the given inspect, or the combination of an optional model and the results of wresiduals.
Axis label will be based on the metadata and descriptions provided in the model's definition, if any.
keywords
observations: The observations to be plotted. When not specified then all observations for the given model will be shown. A subset of observations can be plotted by providing aSymbolorVector{Symbol}of observation names.type: Select which residuals to plot. Options are:wresand:iwresfor weighted population or individual residuals respectively. Default is to plot both.zeroline: Include a zeroline in the plot. Default istrue.paginate: (defaultfalse) Whentruesets the return type of a plot to aVector{Makie.Figure}rather thanMakie.Figurewhich splits the returned plot over several "pages" if there are too many to fit on a single figure comfortably. See also thelimitkeyword which can be used to set the limit of figures per page.limit: Sets the maximum number of axes that can be plotted per page when pagination is active.rows: Sets the maximum number of rows of subplots to be displayed on each paginatedMakie.Figurewhen pagination is active.columns: Sets the maximum number of columns of subplots to be displayed on each paginatedMakie.Figurewhen pagination is active.axis: A key-value object with axis options that gets passed to the underlyingAlgebraOfGraphics.drawcall.figure: A key-value object with figure options that gets passed to the underlyingAlgebraOfGraphics.drawcall. (Does not apply when plotting into an existing figure.)legend: A key-value object with legend options that gets passed to the underlyingAlgebraOfGraphics.drawcall. (Does not apply when plotting into an existing figure.) A legend will be drawn automatically unlesslegend = (; show = false)is set.facet: A key-value object with facet options that gets passed to the underlyingAlgebraOfGraphics.drawcall.colorbar: A key-value object with colorbar options that gets passed to the underlyingAlgebraOfGraphics.drawcall. (Does not apply when plotting into an existing figure.)
Supported Style Keywords
colorstrokecolorstrokewidthzeroline_colorzeroline_linestylezeroline_linewidth
For the fitted_model_inspection variable above the following syntax is used to generate the plot below:
wresiduals_dist(fitted_model_inspection)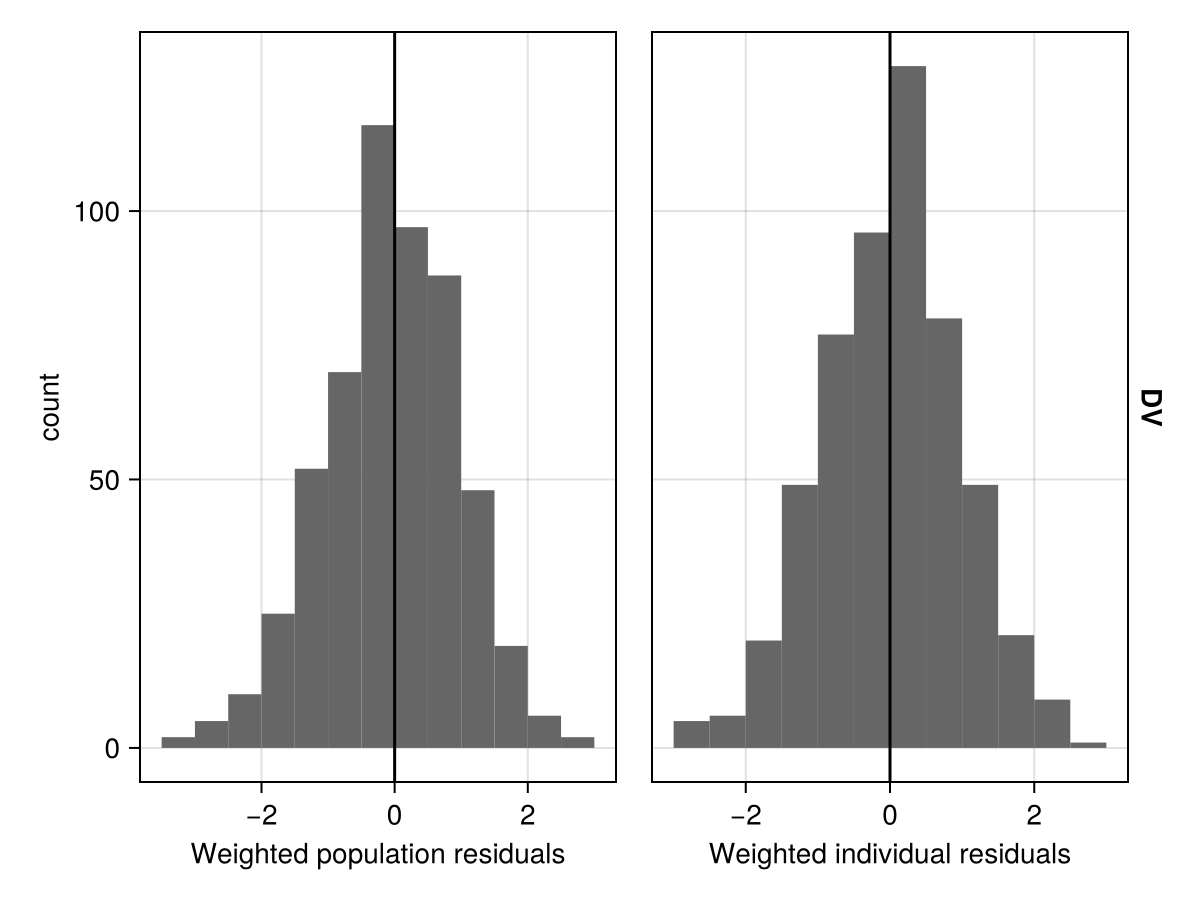
wresiduals_vs_covariates
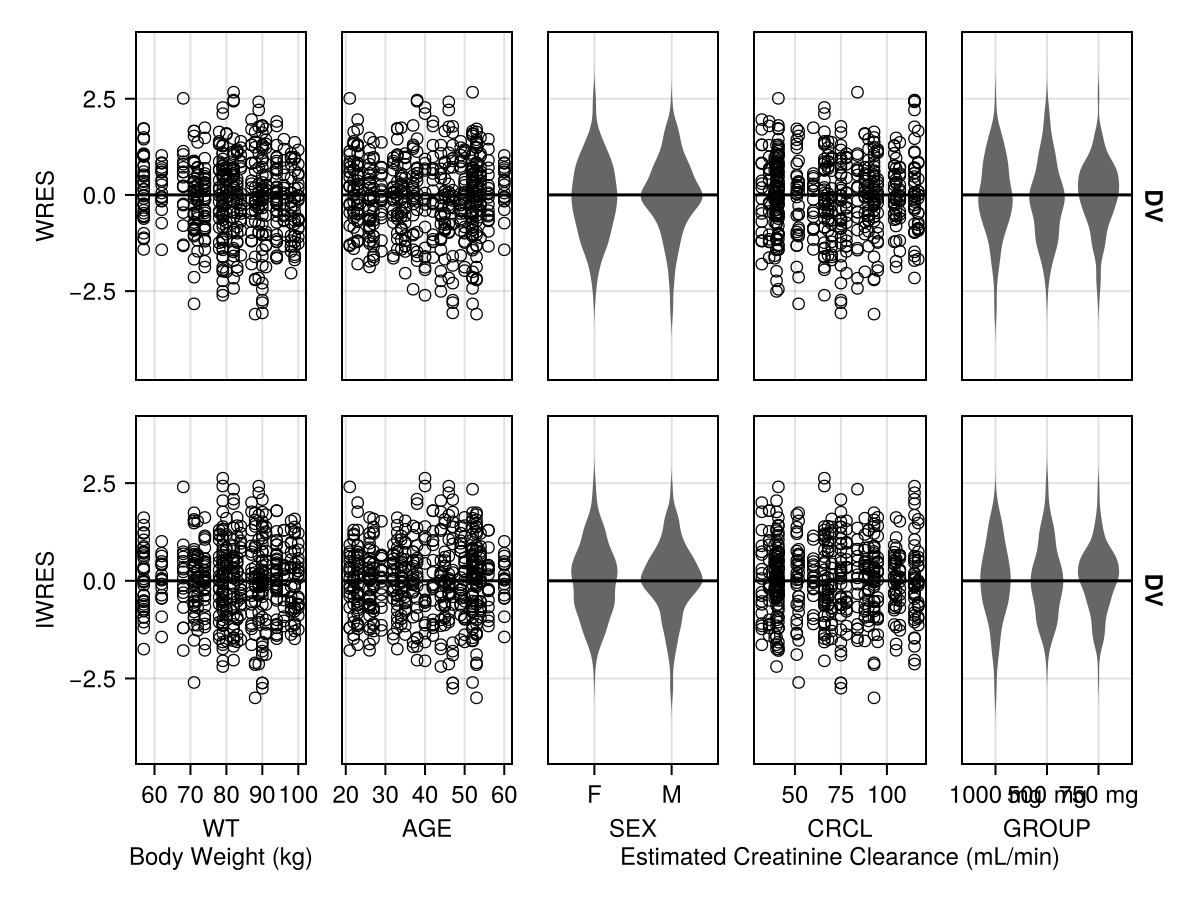
PumasPlots.wresiduals_vs_covariates — Function
wresiduals_vs_covariates(inspect | [model], wresiduals)
wresiduals_vs_covariates(figpos, inspect | [model], wresiduals)
Plot the weighted population residuals versus covariates for the given inspect object, or the combination of an optional model and the results of wresiduals.
Axis label will be based on the metadata and descriptions provided in the model's definition, if any.
Keywords
observations: The observations to be plotted. When not specified then all observations for the given model will be shown. A subset of observations can be plotted by providing aSymbolorVector{Symbol}of observation names.categorical: Select which of the variables should be interpreted as categorical. Provide a vector of symbols corresponding to the names of the categorical variables. By default all variables are treated as continuous.type: Select which residuals to plot. Options are:wresand:iwresfor weighted population or individual residuals respectively. Default is to plot both.covariates: The covariates to be plotted. When not specified then all covariates for the given model will be shown. A subset of covariates can be plotted by providing aSymbolorVector{Symbol}of covariate names.zeroline: Include a zeroline in the plot. Default istrue.paginate: (defaultfalse) Whentruesets the return type of a plot to aVector{Makie.Figure}rather thanMakie.Figurewhich splits the returned plot over several "pages" if there are too many to fit on a single figure comfortably. See also thelimitkeyword which can be used to set the limit of figures per page.limit: Sets the maximum number of axes that can be plotted per page when pagination is active.rows: Sets the maximum number of rows of subplots to be displayed on each paginatedMakie.Figurewhen pagination is active.columns: Sets the maximum number of columns of subplots to be displayed on each paginatedMakie.Figurewhen pagination is active.axis: A key-value object with axis options that gets passed to the underlyingAlgebraOfGraphics.drawcall.figure: A key-value object with figure options that gets passed to the underlyingAlgebraOfGraphics.drawcall. (Does not apply when plotting into an existing figure.)legend: A key-value object with legend options that gets passed to the underlyingAlgebraOfGraphics.drawcall. (Does not apply when plotting into an existing figure.) A legend will be drawn automatically unlesslegend = (; show = false)is set.facet: A key-value object with facet options that gets passed to the underlyingAlgebraOfGraphics.drawcall.colorbar: A key-value object with colorbar options that gets passed to the underlyingAlgebraOfGraphics.drawcall. (Does not apply when plotting into an existing figure.)
Supported Style Keywords
colormarkermarkersizezeroline_colorzeroline_linestylezeroline_linewidth
For the fitted_model_inspection variable above the following syntax is used to generate the plot below:
wresiduals_vs_covariates(
    fitted_model_inspection;
    categorical = [:SEX, :GROUP],
    figure = (; fontsize = 12),
)
wresiduals_vs_predictions
PumasPlots.wresiduals_vs_predictions — Function
wresiduals_vs_predictions(inspect)
wresiduals_vs_predictions(figpos, inspect)
Plot the weighted residuals versus population predictions for the given inspect object.
Axis label will be based on the metadata and descriptions provided in the model's definition, if any.
Keywords
loess: Add a loess fit line to the plot. Default istrue.ols: Add an OLS fit line to the plot. Default istrue.observations: The observations to be plotted. When not specified then all observations for the given model will be shown. A subset of observations can be plotted by providing aSymbolorVector{Symbol}of observation names.zeroline: Include a zeroline in the plot. Default istrue.labels: The custom name to use for each individual series within in the plot such as a scatter or line. Provide aNamedTuplewith any of the following keys and your custom label string:loess,ols, andobserved.paginate: (defaultfalse) Whentruesets the return type of a plot to aVector{Makie.Figure}rather thanMakie.Figurewhich splits the returned plot over several "pages" if there are too many to fit on a single figure comfortably. See also thelimitkeyword which can be used to set the limit of figures per page.limit: Sets the maximum number of axes that can be plotted per page when pagination is active.rows: Sets the maximum number of rows of subplots to be displayed on each paginatedMakie.Figurewhen pagination is active.columns: Sets the maximum number of columns of subplots to be displayed on each paginatedMakie.Figurewhen pagination is active.axis: A key-value object with axis options that gets passed to the underlyingAlgebraOfGraphics.drawcall.figure: A key-value object with figure options that gets passed to the underlyingAlgebraOfGraphics.drawcall. (Does not apply when plotting into an existing figure.)legend: A key-value object with legend options that gets passed to the underlyingAlgebraOfGraphics.drawcall. (Does not apply when plotting into an existing figure.) A legend will be drawn automatically unlesslegend = (; show = false)is set.facet: A key-value object with facet options that gets passed to the underlyingAlgebraOfGraphics.drawcall.colorbar: A key-value object with colorbar options that gets passed to the underlyingAlgebraOfGraphics.drawcall. (Does not apply when plotting into an existing figure.)
Supported Style Keywords
loess_colorloess_linestyleloess_linewidthols_colorols_linestyleols_linewidthzeroline_colorzeroline_linestylezeroline_linewidthmarkermarkercolormarkersize
For the fitted_model_inspection variable above the following syntax is used to generate the plot below:
wresiduals_vs_predictions(fitted_model_inspection)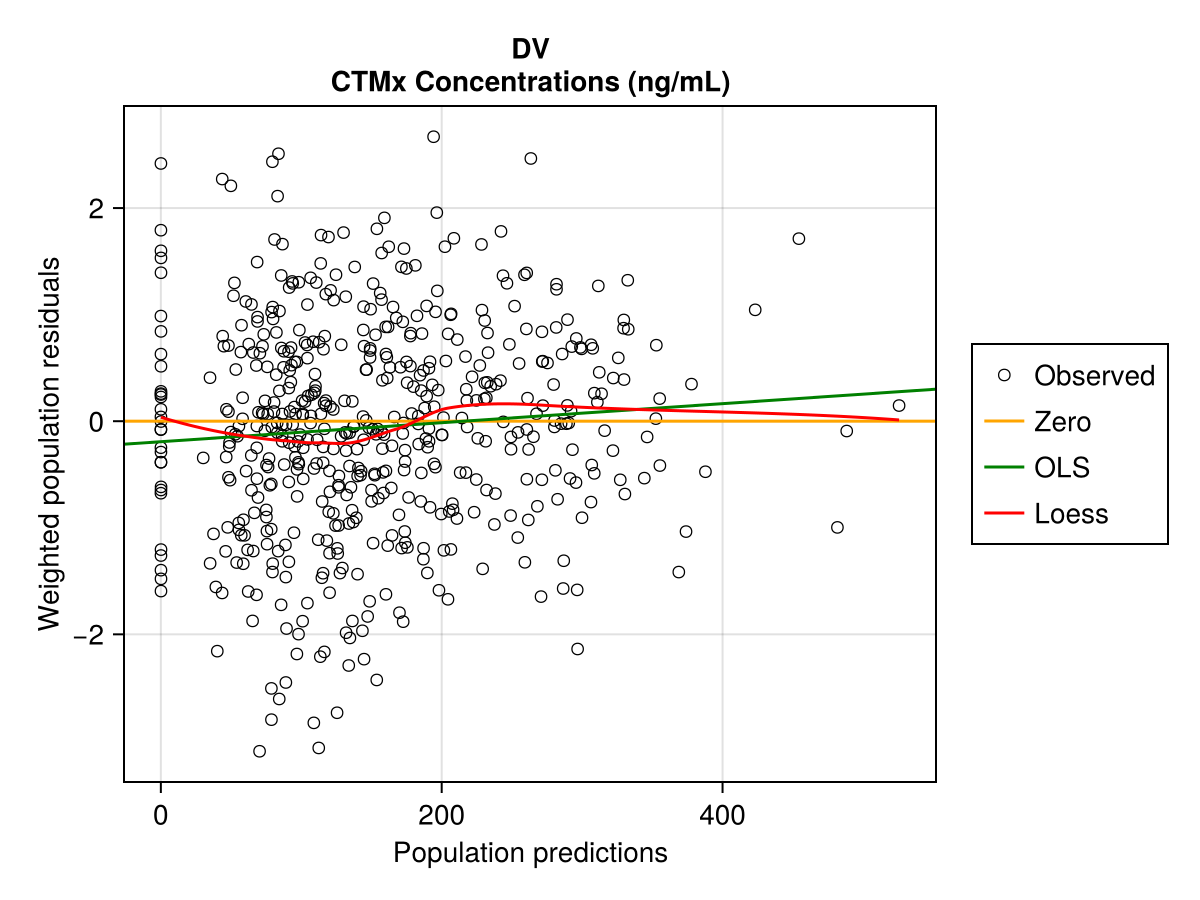
wresiduals_vs_time
PumasPlots.wresiduals_vs_time — Function
wresiduals_vs_time(inspect | [model], wresiduals)
wresiduals_vs_time(figpos, inspect | [model], wresiduals)
Plot the weighted residuals versus time for the given inspect object, or the combination of an optional model and the results of wresiduals.
Axis label will be based on the metadata and descriptions provided in the model's definition, if any.
Keywords
loess: Add a loess fit line to the plot. Default istrue.ols: Add an OLS fit line to the plot. Default istrue.observations: The observations to be plotted. When not specified then all observations for the given model will be shown. A subset of observations can be plotted by providing aSymbolorVector{Symbol}of observation names.zeroline: Include a zeroline in the plot. Default istrue.labels: The custom name to use for each individual series within in the plot such as a scatter or line. Provide aNamedTuplewith any of the following keys and your custom label string:loess,ols, andobserved.paginate: (defaultfalse) Whentruesets the return type of a plot to aVector{Makie.Figure}rather thanMakie.Figurewhich splits the returned plot over several "pages" if there are too many to fit on a single figure comfortably. See also thelimitkeyword which can be used to set the limit of figures per page.limit: Sets the maximum number of axes that can be plotted per page when pagination is active.rows: Sets the maximum number of rows of subplots to be displayed on each paginatedMakie.Figurewhen pagination is active.columns: Sets the maximum number of columns of subplots to be displayed on each paginatedMakie.Figurewhen pagination is active.axis: A key-value object with axis options that gets passed to the underlyingAlgebraOfGraphics.drawcall.figure: A key-value object with figure options that gets passed to the underlyingAlgebraOfGraphics.drawcall. (Does not apply when plotting into an existing figure.)legend: A key-value object with legend options that gets passed to the underlyingAlgebraOfGraphics.drawcall. (Does not apply when plotting into an existing figure.) A legend will be drawn automatically unlesslegend = (; show = false)is set.facet: A key-value object with facet options that gets passed to the underlyingAlgebraOfGraphics.drawcall.colorbar: A key-value object with colorbar options that gets passed to the underlyingAlgebraOfGraphics.drawcall. (Does not apply when plotting into an existing figure.)
Supported Style Keywords
loess_colorloess_linestyleloess_linewidthols_colorols_linestyleols_linewidthzeroline_colorzeroline_linestylezeroline_linewidthmarkermarkercolormarkersize
For the fitted_model_inspection variable above the following syntax is used to generate the plot below:
wresiduals_vs_time(fitted_model_inspection)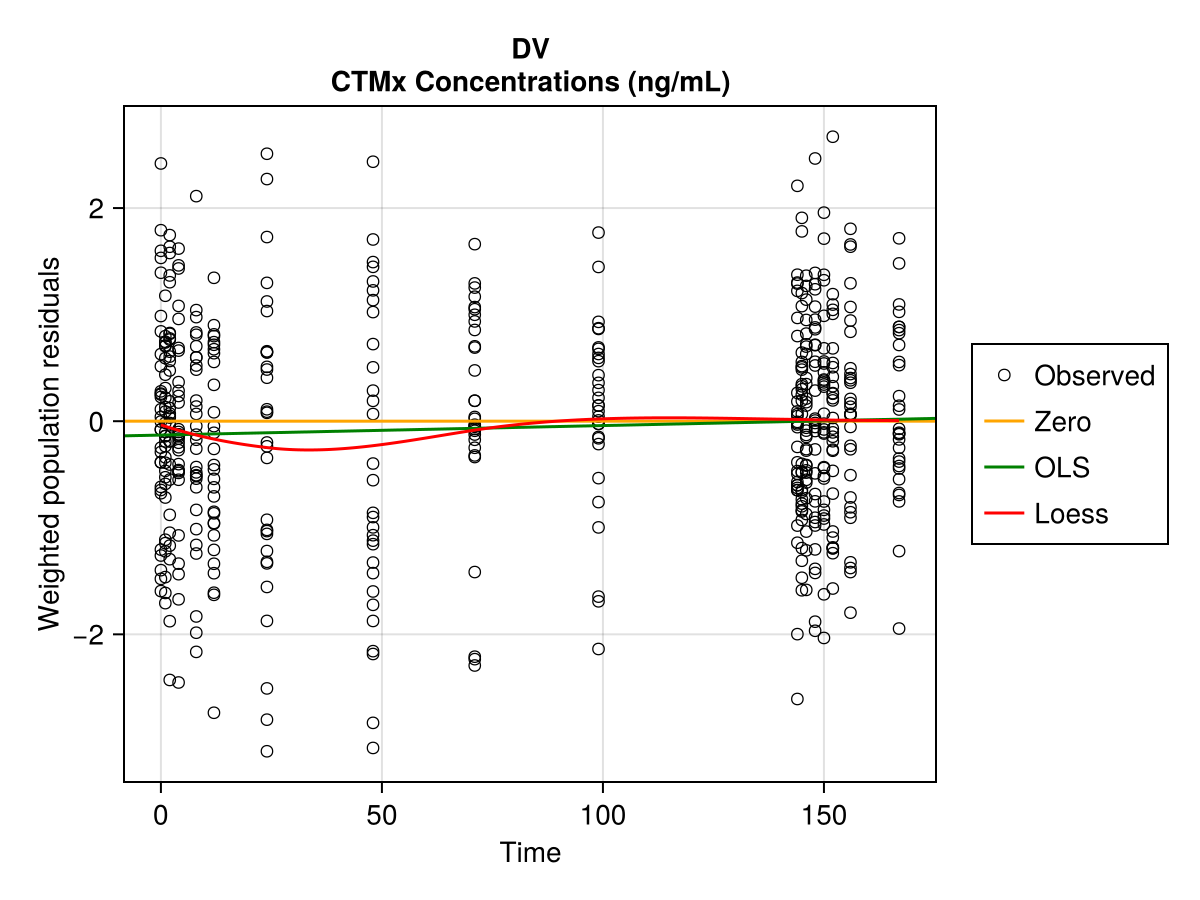
NCA
As with the Pumas plots, we must import the required modules. In this case we import NCAUtilities instead of PumasUtilities:
using NCA
using NCAUtilities
As with the Pumas-specific plots in the previous section, we must also import a Makie "backend":
using CairoMakieThe following plot functions are now available:
groups_checkobservations_vs_timeparameters_distparameters_vs_groupsubject_fitssummary_observations_vs_time
For the example plots below we will be using the following NCA analysis results:
using NCA
using NCAUtilities
using CairoMakie
using DataFramesMeta
using PharmaDatasets

pkpain_df = dataset("pk_painrelief")
pkpain_noplb_df = @chain pkpain_df begin
    @rsubset !(occursin("Placebo", :Dose))
    # adding route variable
    @rtransform :route = "ev"
    # creating an `amt` column
    @rtransform :Dose = parse(Int, chop(:Dose; tail = 3))
    @rtransform :amt = ifelse(:Time == 0, :Dose, missing)
end

pkpain_nca = read_nca(
    pkpain_noplb_df;
    id = :Subject,
    time = :Time,
    amt = :amt,
    observations = :Conc,
    group = [:Dose],
    route = :route,
)

pk_nca_report = run_nca(pkpain_nca);
NCA Report
Timestamp: 2026-03-30T07:44:04.769
Version number: 0.1.0
Output Parameters DataFrame
120×39 DataFrame
Row │ id Dose dose tlag tmax cmax tlast clast clast_pred auclast kel half_li ⋯
│ String Int64 Int64 Float64 Float64 Float64 Float64 Float64 Float64 Float64 Float64 Float64 ⋯
─────┼──────────────────────────────────────────────────────────────────────────────────────────────────────────────────
1 │ 6 5 5 0.0 1.0 0.316115 8.0 0.110616 0.107079 1.55654 0.150864 4.594 ⋯
2 │ 8 5 5 0.0 0.5 0.335649 8.0 0.0962241 0.0960789 1.49816 0.145379 4.767
3 │ 9 5 5 0.0 0.5 0.538566 8.0 0.0430812 0.0387015 1.36954 0.311397 2.225
4 │ 12 5 5 0.0 1.0 0.215302 8.0 0.0664953 0.0653076 1.06346 0.18442 3.758
5 │ 17 5 5 0.0 1.0 0.190482 8.0 0.0558857 0.0553108 0.948083 0.242127 2.862 ⋯
6 │ 24 5 5 0.0 1.0 0.264185 8.0 0.0246395 0.0236468 0.908137 0.349102 1.985
7 │ 29 5 5 0.0 0.5 0.353126 8.0 0.0376847 0.0366889 1.17073 0.308391 2.247
8 │ 32 5 5 0.0 0.5 0.311369 8.0 0.151186 0.143299 1.59197 0.0836439 8.286
9 │ 38 5 5 0.0 0.5 0.295493 8.0 0.0771599 0.0758813 1.16789 0.132415 5.234 ⋯
10 │ 40 5 5 0.0 0.5 0.44879 8.0 0.0650122 0.0645857 1.38371 0.185449 3.737
11 │ 41 5 5 0.0 1.0 0.389452 8.0 0.0577462 0.0556905 1.46964 0.28217 2.456
⋮ │ ⋮ ⋮ ⋮ ⋮ ⋮ ⋮ ⋮ ⋮ ⋮ ⋮ ⋮ ⋮ ⋱
111 │ 121 80 80 0.0 0.5 4.89372 8.0 1.27737 1.27233 20.3445 0.143447 4.832
112 │ 124 80 80 0.0 1.0 4.35551 8.0 1.1764 1.19652 18.2255 0.1429 4.850 ⋯
113 │ 129 80 80 0.0 1.5 4.59649 8.0 1.05441 1.05754 20.3758 0.225433 3.074
114 │ 135 80 80 0.0 0.5 8.06179 8.0 1.98553 1.98253 33.2028 0.177016 3.915
115 │ 141 80 80 0.0 0.5 5.5345 8.0 1.21459 1.2196 22.4116 0.146967 4.716
116 │ 143 80 80 0.0 0.5 6.92909 8.0 0.48772 0.49018 19.1488 0.287524 2.410 ⋯
117 │ 148 80 80 0.0 0.5 6.74645 8.0 0.268057 0.269778 12.7551 0.280645 2.469
118 │ 149 80 80 0.0 0.5 6.03496 8.0 1.84537 1.57059 23.4167 0.151058 4.588
119 │ 156 80 80 0.0 0.5 7.14045 8.0 2.16965 2.1709 31.9854 0.149409 4.639
120 │ 159 80 80 0.0 1.0 7.12166 8.0 2.33494 2.3207 34.8896 0.164058 4.225 ⋯
28 columns and 99 rows omittedgroups_check
NCAUtilities.groups_check — Function
groups_check(population | report)
groups_check(figpos, population | report)
Keywords
group: Select which group from stratified input data to plot.paginate: (defaultfalse) Whentruesets the return type of a plot to aVector{Makie.Figure}rather thanMakie.Figurewhich splits the returned plot over several "pages" if there are too many to fit on a single figure comfortably. See also thelimitkeyword which can be used to set the limit of figures per page.limit: Sets the maximum number of axes that can be plotted per page when pagination is active.rows: Sets the maximum number of rows of subplots to be displayed on each paginatedMakie.Figurewhen pagination is active.columns: Sets the maximum number of columns of subplots to be displayed on each paginatedMakie.Figurewhen pagination is active.axis: A key-value object with axis options that gets passed to the underlyingAlgebraOfGraphics.drawcall.figure: A key-value object with figure options that gets passed to the underlyingAlgebraOfGraphics.drawcall. (Does not apply when plotting into an existing figure.)legend: A key-value object with legend options that gets passed to the underlyingAlgebraOfGraphics.drawcall. (Does not apply when plotting into an existing figure.) A legend will be drawn automatically unlesslegend = (; show = false)is set.facet: A key-value object with facet options that gets passed to the underlyingAlgebraOfGraphics.drawcall.colorbar: A key-value object with colorbar options that gets passed to the underlyingAlgebraOfGraphics.drawcall. (Does not apply when plotting into an existing figure.)
Supported Style Keywords
colormarkersize
For the dataset above, the following syntax is used to generate the plot below
groups_check(pk_nca_report; axis = (; ylabel = "Dose (mg)", xticks = 25:25:100))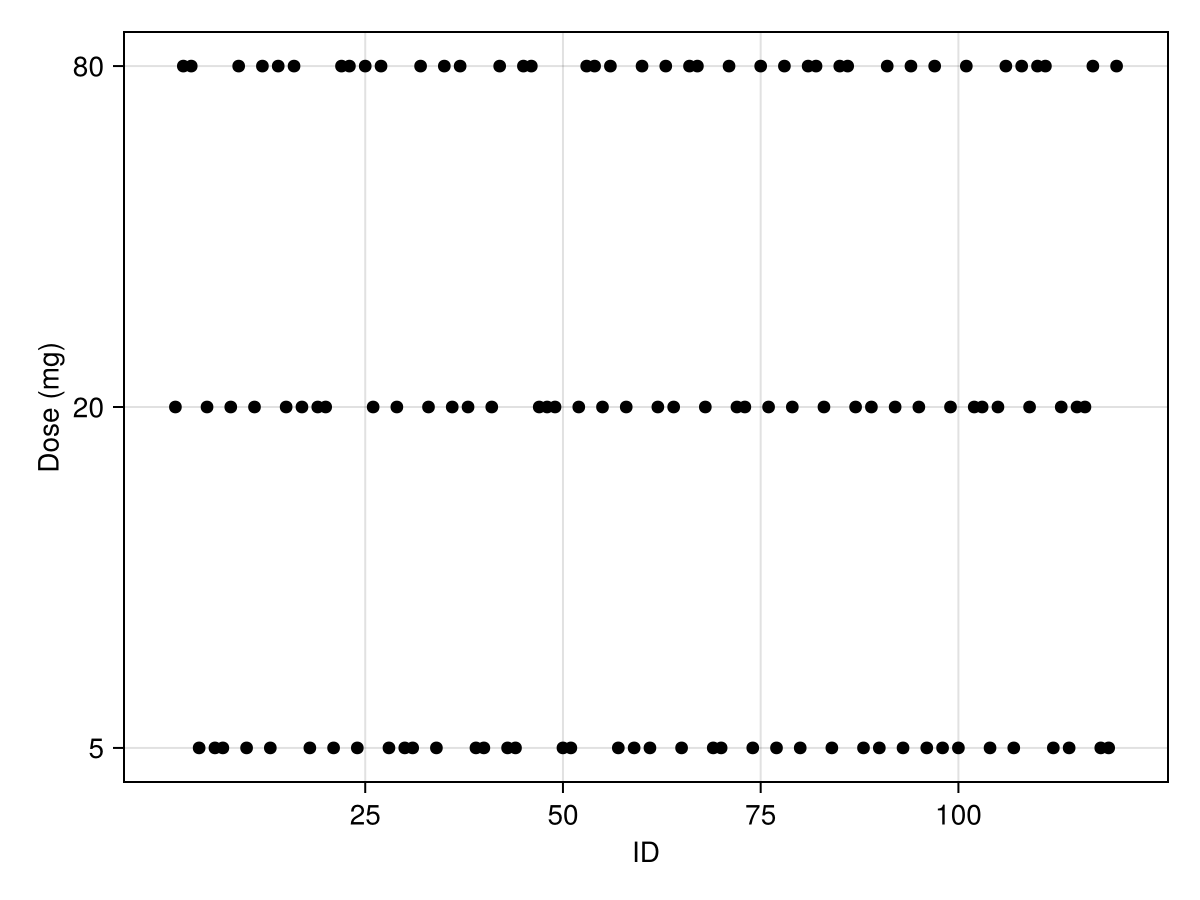
observations_vs_time
PlottingUtilities.observations_vs_time — Function
observations_vs_time(subject | population | report)
observations_vs_time(figpos, subject | population | report)
Keywords
llq: Set to a numeric value to display a horizontal line indicating the Lower Limit of Quantification (LLQ). Defaults tonothing(no line).ids: Select which subject IDs to display. Can be either a single ID or aVectorof IDs. Note that the type of the ID must match those in the population, i.e. a value1is not the same as a"1".labels: The custom name to use for each individual series within in the plot such as a scatter or line. Provide aNamedTuplewith any of the following keys and your custom label string:observed.paginate: (defaultfalse) Whentruesets the return type of a plot to aVector{Makie.Figure}rather thanMakie.Figurewhich splits the returned plot over several "pages" if there are too many to fit on a single figure comfortably. See also thelimitkeyword which can be used to set the limit of figures per page.limit: Sets the maximum number of axes that can be plotted per page when pagination is active.rows: Sets the maximum number of rows of subplots to be displayed on each paginatedMakie.Figurewhen pagination is active.columns: Sets the maximum number of columns of subplots to be displayed on each paginatedMakie.Figurewhen pagination is active.axis: A key-value object with axis options that gets passed to the underlyingAlgebraOfGraphics.drawcall.figure: A key-value object with figure options that gets passed to the underlyingAlgebraOfGraphics.drawcall. (Does not apply when plotting into an existing figure.)legend: A key-value object with legend options that gets passed to the underlyingAlgebraOfGraphics.drawcall. (Does not apply when plotting into an existing figure.) A legend will be drawn automatically unlesslegend = (; show = false)is set.facet: A key-value object with facet options that gets passed to the underlyingAlgebraOfGraphics.drawcall.colorbar: A key-value object with colorbar options that gets passed to the underlyingAlgebraOfGraphics.drawcall. (Does not apply when plotting into an existing figure.)
Supported Style Keywords
- `color`
- `linestyle`
- `linewidth`
- `markercolor`
- `markersize`
- `group_fontsize`
- `llq_color`: Color of the LLQ line (default: `Makie.automatic`).
- `llq_linestyle`: Linestyle of the LLQ line (default: `Makie.automatic`).
- `llq_label`: Label for the LLQ line in the legend (default: "LLQ").
- `llq_linewidth`: Linewidth of the LLQ line (default: `Makie.automatic`).
For the dataset above, the following syntax is used to generate the plot below
figures = observations_vs_time(
    pkpain_nca;
    axis = (; xlabel = "Time (hours)", ylabel = "CTMX Concentration (μg/mL)"),
    paginate = true,
)

figures[1]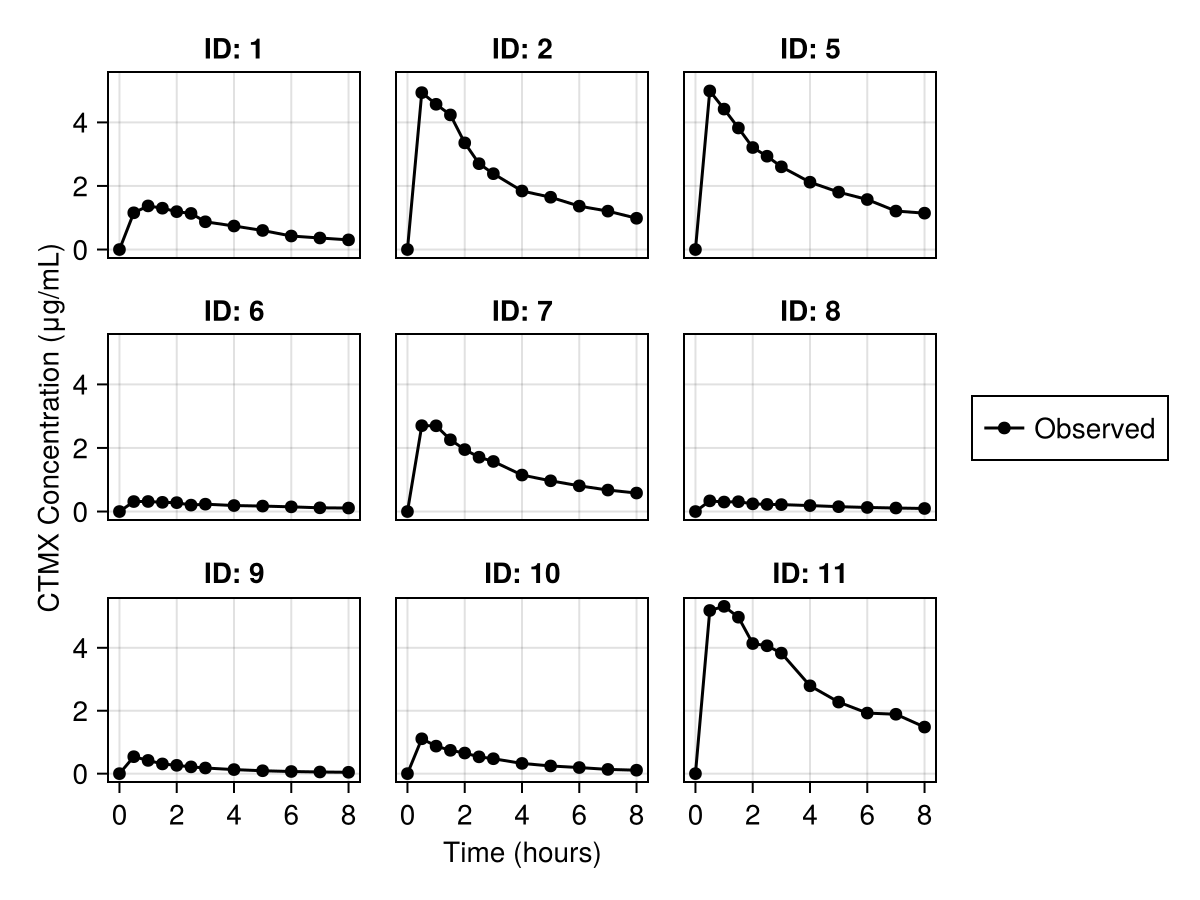
Since there are many subjects within the given data pkpain_nca we paginate the resulting plots such that the maximum number of subplots per page is limited to a reasonable number, 9 in a 3-by-3 grid for observations_vs_time plots. We can also adjust the appearance of the sub-plots by using the facet keyword to combine common axis labels into well-placed multi-axis labels. Notice that we display only figures[1] below while figures contains 14 separate Figure objects containing plots.
summary_observations_vs_time
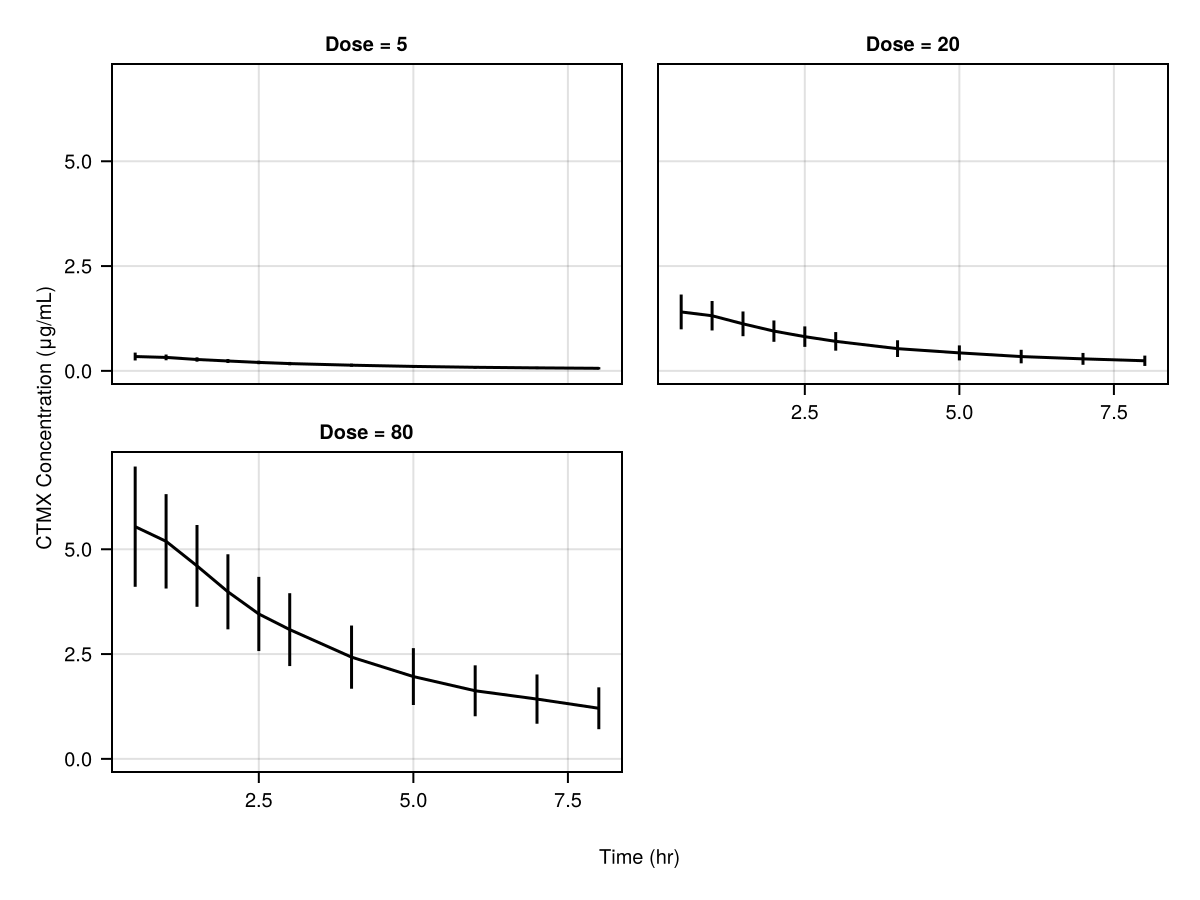
NCAUtilities.summary_observations_vs_time — Function
summary_observations_vs_time(population | report)
summary_observations_vs_time(figpos, population | report)
Keywords
statistic: Select whether to use:meanor:geomeanfor the statistic.errorbars: Set tofalseto hide error bars.separate: Set tofalseto overlay all groups on a single axis.show_subjects: Set totrueto overlay individual traces ("spaghetti plots")llq: Set to a numeric value to display a horizontal line indicating the Lower Limit of Quantification (LLQ). Defaults tonothing(no line).group: Select which group from stratified input data to plot.paginate: (defaultfalse) Whentruesets the return type of a plot to aVector{Makie.Figure}rather thanMakie.Figurewhich splits the returned plot over several "pages" if there are too many to fit on a single figure comfortably. See also thelimitkeyword which can be used to set the limit of figures per page.limit: Sets the maximum number of axes that can be plotted per page when pagination is active.rows: Sets the maximum number of rows of subplots to be displayed on each paginatedMakie.Figurewhen pagination is active.columns: Sets the maximum number of columns of subplots to be displayed on each paginatedMakie.Figurewhen pagination is active.axis: A key-value object with axis options that gets passed to the underlyingAlgebraOfGraphics.drawcall.figure: A key-value object with figure options that gets passed to the underlyingAlgebraOfGraphics.drawcall. (Does not apply when plotting into an existing figure.)legend: A key-value object with legend options that gets passed to the underlyingAlgebraOfGraphics.drawcall. (Does not apply when plotting into an existing figure.) A legend will be drawn automatically unlesslegend = (; show = false)is set.facet: A key-value object with facet options that gets passed to the underlyingAlgebraOfGraphics.drawcall.colorbar: A key-value object with colorbar options that gets passed to the underlyingAlgebraOfGraphics.drawcall. (Does not apply when plotting into an existing figure.)
Supported Style Keywords
color: Either any scalar color that Makie can handle, or ifseparate = falseand the population is grouped, a vector of colors (for example usingMakie.categorical_colorsor manually specified) or aPlotUtils.CategoricalColorGradient(whatMakie.cgrad(colormap, n, categorical = true)returns) with at least as many colors as there are groups. In this case, the groups 1 to n will get the colors 1 to n from these objects. Unused colors are ignored.linewidthlinestylemarkermarkercolormarkersizeerrorbar_colorerrorbar_linewidtherrorbar_linestylewhiskerwidthsubjects_color: Either any scalar color that Makie can handle or a number between 0 and 1 which takes the main color and applies the number as an alpha value to it.subjects_linewidthsubjects_linestylellq_color: Color of the LLQ line (default:Makie.automatic).llq_linestyle: Linestyle of the LLQ line (default:Makie.automatic).llq_label: Label for the LLQ line in the legend (default: "LLQ").llq_linewidth: Linewidth of the LLQ line (default:Makie.automatic).
For the dataset above, the following syntax is used to generate the plot below
summary_observations_vs_time(
    pkpain_nca;
    figure = (; fontsize = 10,),
    axis = (; xlabel = "Time (hr)", ylabel = "CTMX Concentration (μg/mL)"),
)
parameters_vs_group
NCAUtilities.parameters_vs_group — Function
parameters_vs_group(report)
parameters_vs_group(figpos, report)
Keywords
group: Select which group from stratified input data to plot.parameter: The name of the parameter to plot given as aSymbol.paginate: (defaultfalse) Whentruesets the return type of a plot to aVector{Makie.Figure}rather thanMakie.Figurewhich splits the returned plot over several "pages" if there are too many to fit on a single figure comfortably. See also thelimitkeyword which can be used to set the limit of figures per page.limit: Sets the maximum number of axes that can be plotted per page when pagination is active.rows: Sets the maximum number of rows of subplots to be displayed on each paginatedMakie.Figurewhen pagination is active.columns: Sets the maximum number of columns of subplots to be displayed on each paginatedMakie.Figurewhen pagination is active.axis: A key-value object with axis options that gets passed to the underlyingAlgebraOfGraphics.drawcall.figure: A key-value object with figure options that gets passed to the underlyingAlgebraOfGraphics.drawcall. (Does not apply when plotting into an existing figure.)legend: A key-value object with legend options that gets passed to the underlyingAlgebraOfGraphics.drawcall. (Does not apply when plotting into an existing figure.) A legend will be drawn automatically unlesslegend = (; show = false)is set.facet: A key-value object with facet options that gets passed to the underlyingAlgebraOfGraphics.drawcall.colorbar: A key-value object with colorbar options that gets passed to the underlyingAlgebraOfGraphics.drawcall. (Does not apply when plotting into an existing figure.)
Supported Style Keywords
colormarkersize
For the pk_nca report generated above, the following syntax is used to generate the plot below
parameters_vs_group(pk_nca_report; parameter = :aucinf_obs)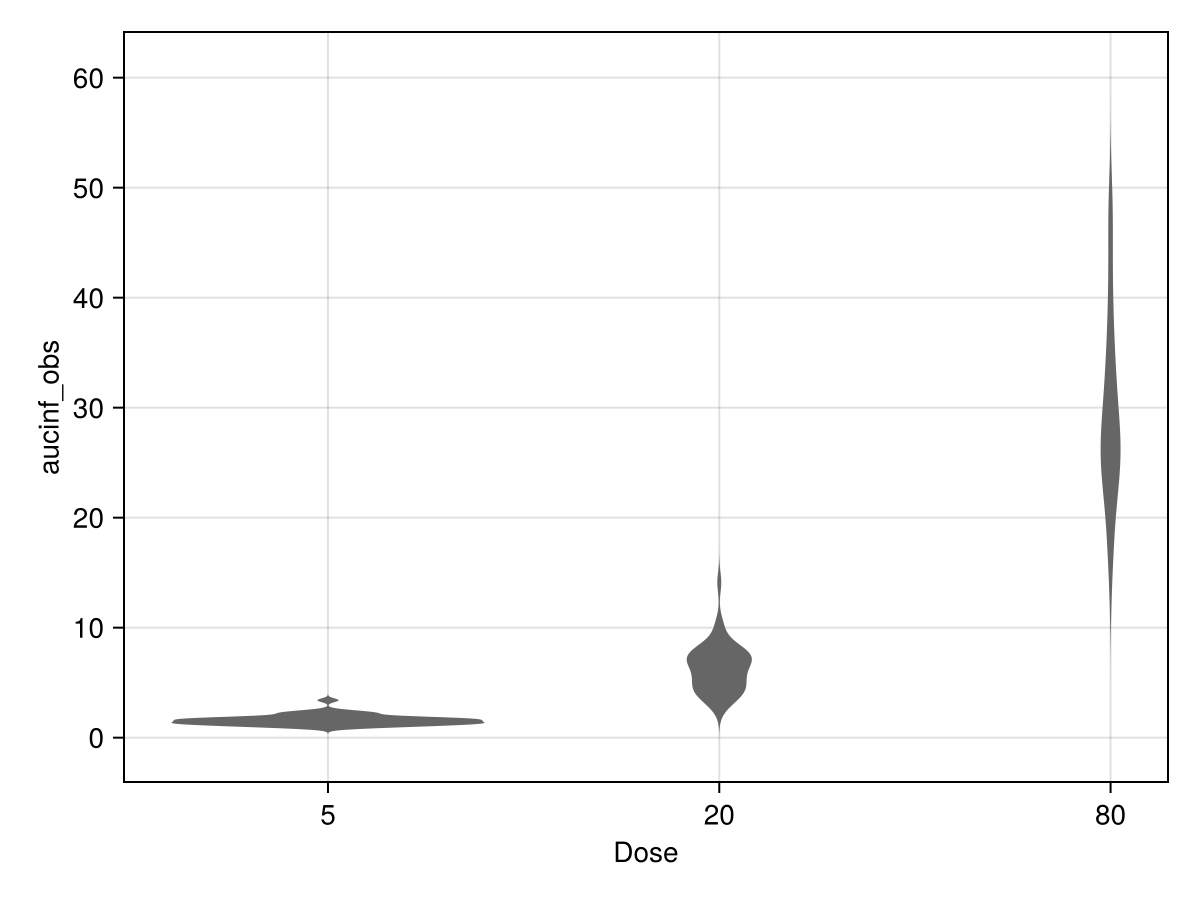
parameters_dist
NCAUtilities.parameters_dist — Function
parameters_dist(report)
parameters_dist(figpos, report)
Keywords
parameter: The name of the parameter to plot given as aSymbol.group: Select which group from stratified input data to plot.paginate: (defaultfalse) Whentruesets the return type of a plot to aVector{Makie.Figure}rather thanMakie.Figurewhich splits the returned plot over several "pages" if there are too many to fit on a single figure comfortably. See also thelimitkeyword which can be used to set the limit of figures per page.limit: Sets the maximum number of axes that can be plotted per page when pagination is active.rows: Sets the maximum number of rows of subplots to be displayed on each paginatedMakie.Figurewhen pagination is active.columns: Sets the maximum number of columns of subplots to be displayed on each paginatedMakie.Figurewhen pagination is active.axis: A key-value object with axis options that gets passed to the underlyingAlgebraOfGraphics.drawcall.figure: A key-value object with figure options that gets passed to the underlyingAlgebraOfGraphics.drawcall. (Does not apply when plotting into an existing figure.)legend: A key-value object with legend options that gets passed to the underlyingAlgebraOfGraphics.drawcall. (Does not apply when plotting into an existing figure.) A legend will be drawn automatically unlesslegend = (; show = false)is set.facet: A key-value object with facet options that gets passed to the underlyingAlgebraOfGraphics.drawcall.colorbar: A key-value object with colorbar options that gets passed to the underlyingAlgebraOfGraphics.drawcall. (Does not apply when plotting into an existing figure.)
Supported Style Keywords
colorstrokecolorstrokewidth
For the pk_nca report generated above, the following syntax is used to generate the plot below
parameters_dist(pk_nca_report; parameter = :aucinf_obs)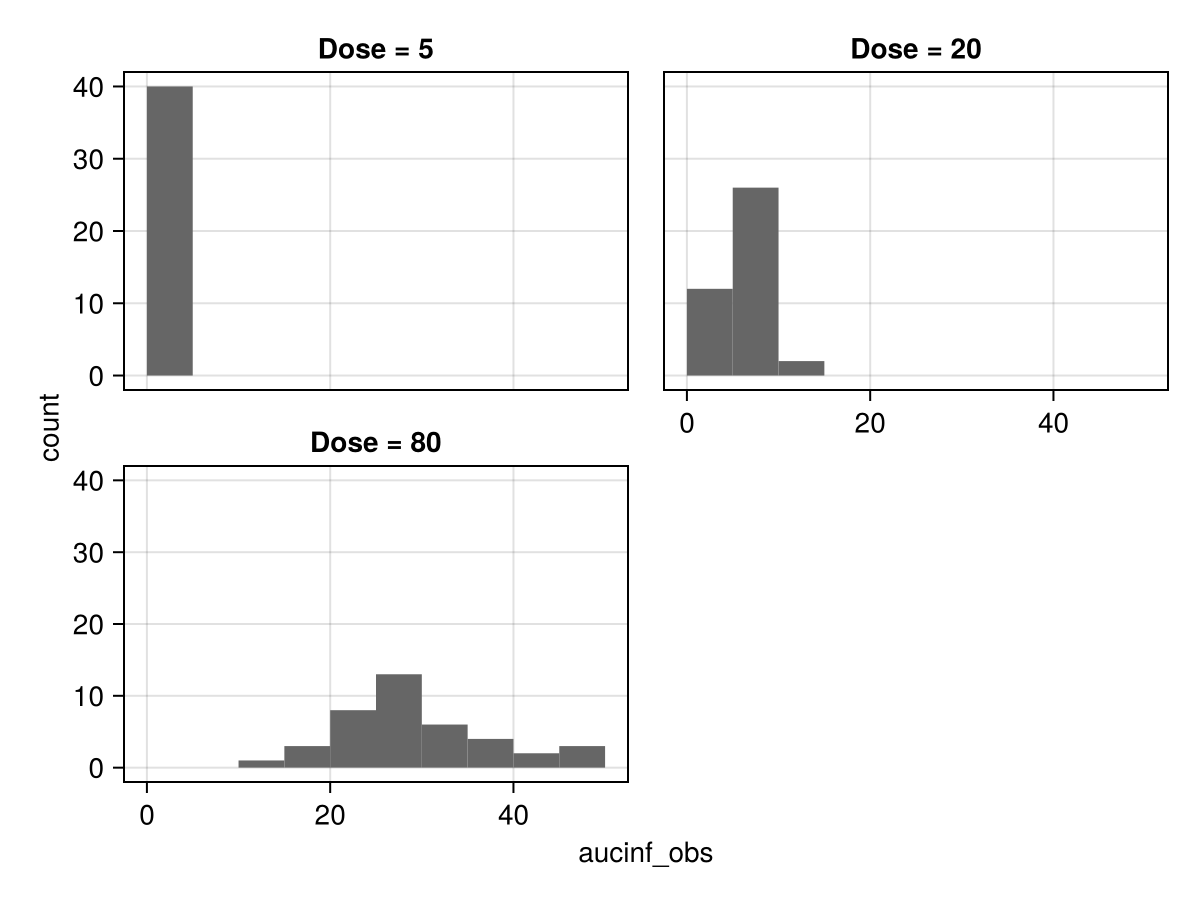
subject_fits
PlottingUtilities.subject_fits — Function
subject_fits(subject | population | report)
subject_fits(figpos, subject | population | report)
Keywords
llq: Set to a numeric value to display a horizontal line indicating the Lower Limit of Quantification (LLQ). Defaults tonothing(no line).ids: Select which subject IDs to display. Can be either a single ID or aVectorof IDs. Note that the type of the ID must match those in the population, i.e. a value1is not the same as a"1".labels: The custom name to use for each individual series within in the plot such as a scatter or line. Provide aNamedTuplewith any of the following keys and your custom label string:observed,cpred, andremoved.paginate: (defaultfalse) Whentruesets the return type of a plot to aVector{Makie.Figure}rather thanMakie.Figurewhich splits the returned plot over several "pages" if there are too many to fit on a single figure comfortably. See also thelimitkeyword which can be used to set the limit of figures per page.limit: Sets the maximum number of axes that can be plotted per page when pagination is active.rows: Sets the maximum number of rows of subplots to be displayed on each paginatedMakie.Figurewhen pagination is active.columns: Sets the maximum number of columns of subplots to be displayed on each paginatedMakie.Figurewhen pagination is active.axis: A key-value object with axis options that gets passed to the underlyingAlgebraOfGraphics.drawcall.figure: A key-value object with figure options that gets passed to the underlyingAlgebraOfGraphics.drawcall. (Does not apply when plotting into an existing figure.)legend: A key-value object with legend options that gets passed to the underlyingAlgebraOfGraphics.drawcall. (Does not apply when plotting into an existing figure.) A legend will be drawn automatically unlesslegend = (; show = false)is set.facet: A key-value object with facet options that gets passed to the underlyingAlgebraOfGraphics.drawcall.colorbar: A key-value object with colorbar options that gets passed to the underlyingAlgebraOfGraphics.drawcall. (Does not apply when plotting into an existing figure.)
Supported Style Keywords
- `cpred_color`
- `cpred_linestyle`
- `cpred_linewidth`
- `removed_color`
- `removed_marker`
- `removed_markersize`
- `markercolor`
- `markerstyle`
- `group_fontsize`
- `llq_color`: Color of the LLQ line (default: `Makie.automatic`).
- `llq_linestyle`: Linestyle of the LLQ line (default: `Makie.automatic`).
- `llq_label`: Label for the LLQ line in the legend (default: "LLQ").
- `llq_linewidth`: Linewidth of the LLQ line (default: `Makie.automatic`).
For the pk_nca report generated above, the following syntax is used to generate the plot below
figures = subject_fits(
    pk_nca_report;
    paginate = true,
    figure = (; fontsize = 12,),
    axis = (; xlabel = "Time (hr)", ylabel = "CTMX Concentration (μg/mL)"),
)

figures[1]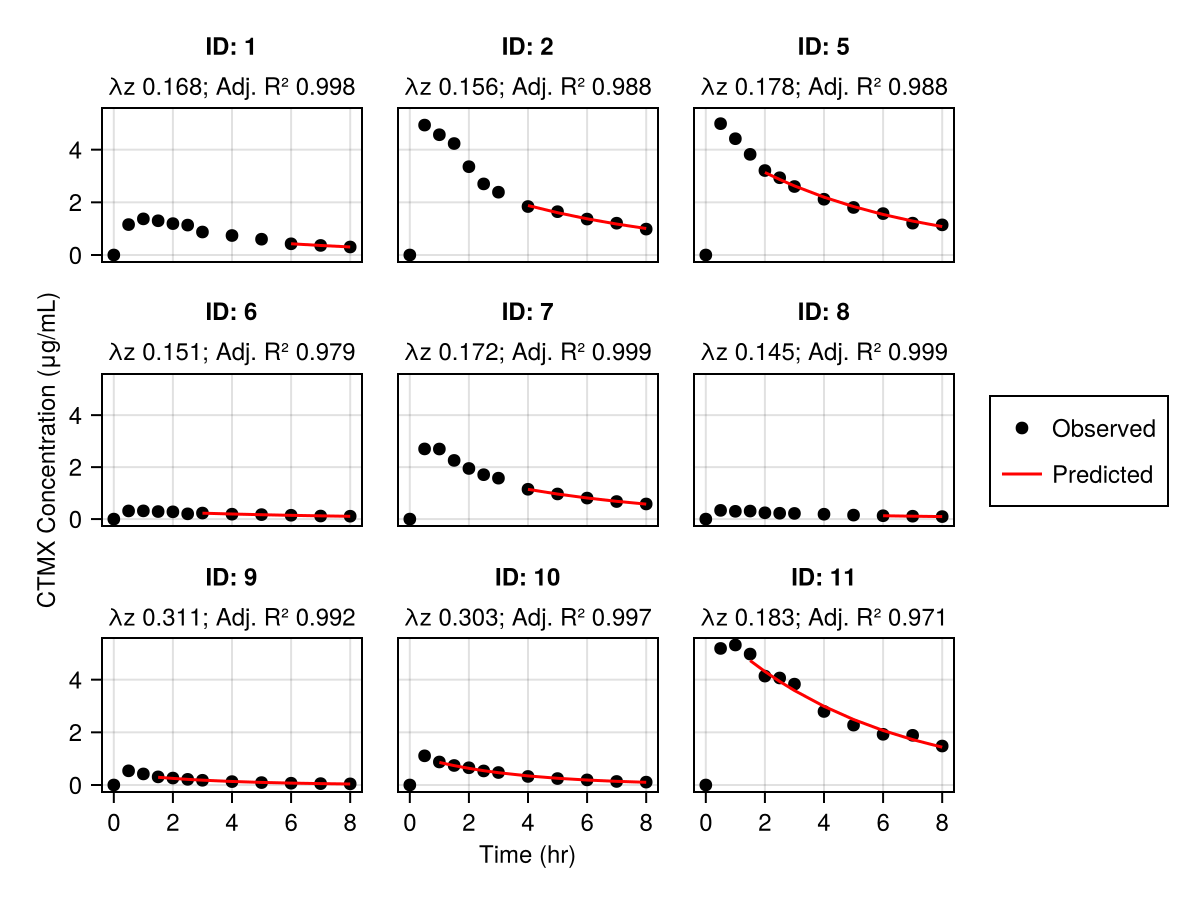
The same plot above can be generated using the subject_fits(population) where only the lambdaz fits are computed.
Customizing Plots
The provided plotting functions discussed in the previous sections provide numerous customization options in the form of keywords for controlling visual aspects such as line colors and styles, titles, and axis labels. What these keywords do not control is the layout of a Figure in a "global" sense, since they are concerned with the customization of the axis that the plot is contained within.
To create more complex layouts of plots that incorporates the plots discussed above we can make use of Figure objects directly and in particular GridPositions that control where to place individual sub-plots. For a complete treatment of Makie's layout capabilities please refer directly to its documentation since we will only cover the basics here.
In the following example we will create a Figure that contains two different plots as sub-plots. Firstly, we must create a Figure object directly. Ensure that you have called using CairoMakie to import the Figure into your current namespace so that you can use it.
figure = Figure(; fontsize = 12);Note that Figure takes all the same arguments that you can provide to the figure keyword when creating plots using the previously discussed plotting functions above.
Next we need to select the position within the figure that we would like to place each of our subplots. To do this Figures make use of array-indexing syntax, i.e. [].
observations_vs_time(figure[1, 1], model, pop; observations = :DV)
observations_vs_ipredictions(figure[1, 2], fitted_model_inspection; observations = :DV)
figure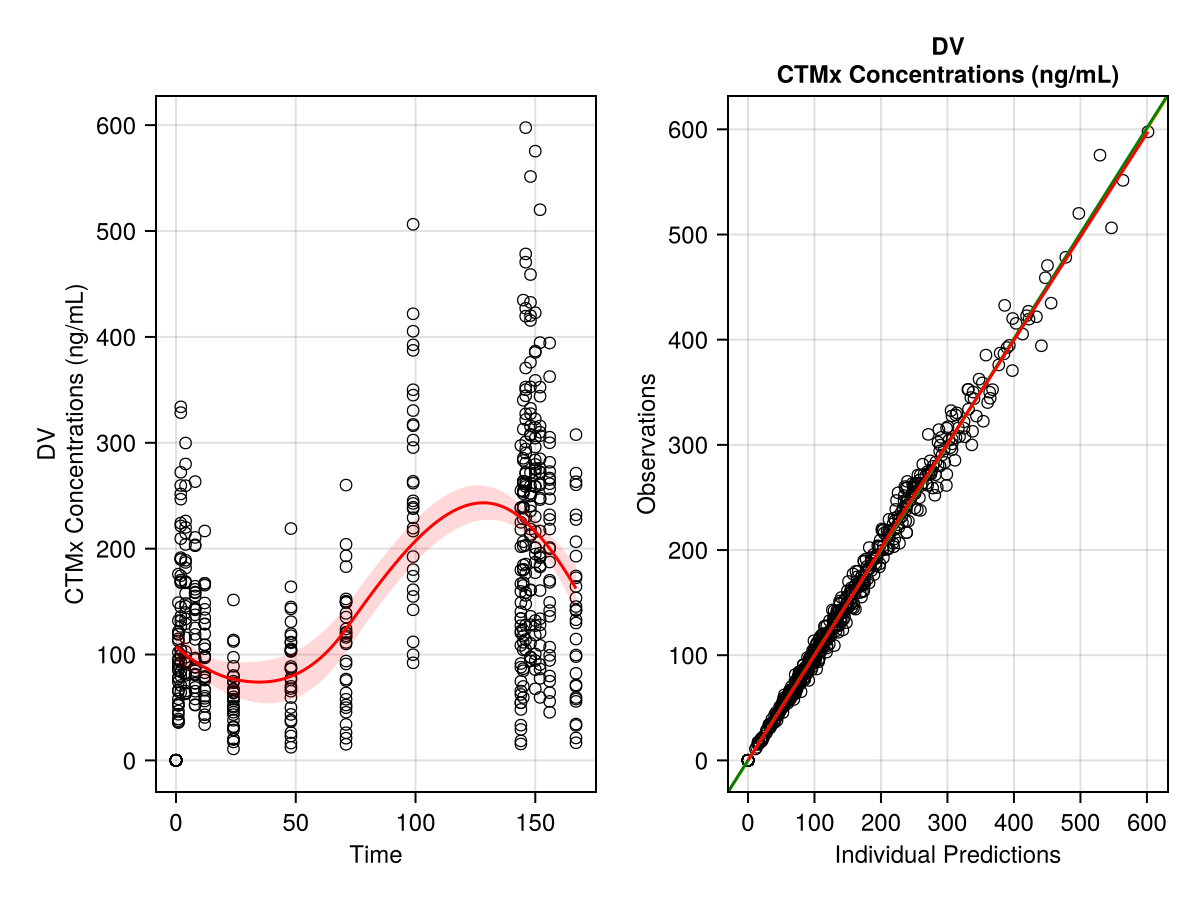
Above we have placed an observations_vs_time plot at row 1 and column 1 and then placed an observations_vs_ipredictions plot at row 1 and column 2, i.e. side-by-side.