Supplying Dissolution Curves
The dissolution input to run_ivivc does not have to be data. A formulation can be described by any callable that maps a vector of times to fractions dissolved — a model fitted in an earlier study, a curve digitised from a report, or a mechanistic release model of your own. This page runs the pipeline on such curves.
Assume the curves already exist. Here they are written out from scratch with fixed parameters: three formulations get a WeibullDissolution with known parameters, the fourth a plain function.
times = collect(0.0:0.5:48.0)
first_order(t) = 1 .- exp.(-t ./ 6)   # FormD: first-order release, mean dissolution time 6 h

diss_curves = Dict(
    "FormA" => (times, WeibullDissolution(1.0, 4.0, 1.5, 0.0, 0.0)),
    "FormB" => (times, WeibullDissolution(1.0, 8.0, 1.5, 0.0, 0.0)),
    "FormC" => (times, WeibullDissolution(1.0, 10.0, 1.5, 0.0, 0.0)),
    "FormD" => (times, first_order),
)
Each entry is a (times, callable) pair. The callable is evaluated wherever the pipeline needs the curve, and times is the grid on which the formulation counts as observed — it sets where predictions are reported. The callable must accept a vector of times and return one value per time; for a scalar formula f, pass t -> f.(t).
The dictionary goes in where the dissolution DataFrame normally does:
result = run_ivivc(
    pk_df,
    diss_curves;
    fast_formulation = "IV",
    validation_formulation = "FormB",
);coeftable(result.model)| Row | parameter | constant | estimate |
|---|---|---|---|
| Symbol | Bool | Float64 | |
| 1 | abs_scale | false | 0.988062 |
| 2 | abs_intercept | false | 0.00336429 |
| 3 | time_scale | false | 0.840814 |
| 4 | time_shift | false | -0.0906479 |
result.pe_summary_df| Row | formulation | auc_predicted | auc_observed | pe_auc | cmax_predicted | cmax_observed | pe_cmax |
|---|---|---|---|---|---|---|---|
| String | Float64 | Float64 | Float64 | Float64 | Float64 | Float64 | |
| 1 | FormB | 49.9626 | 50.456 | 0.977934 | 2.85717 | 2.87857 | 0.743637 |
dissolution_profiles(result)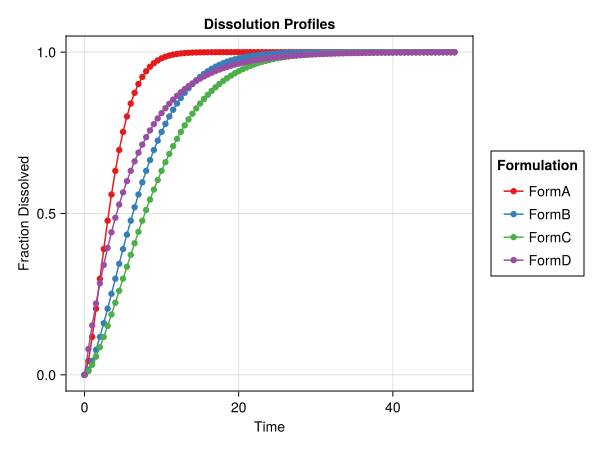
ivivc_correlation(result)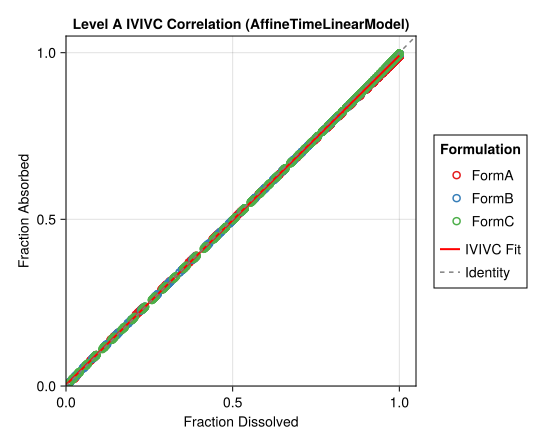
The same dictionary is accepted wherever dissolution goes in — fit_ivivc, predict_rate and the plots as well as run_ivivc. To fit the curves to data instead of writing them down, see Parametric Dissolution Models.