Dissolution Similarity (f1/f2)
Unlike the Getting started example, which walks through the full IVIVC pipeline, this guide focuses on the f1 difference factor and f2 similarity factor — the FDA's standard metrics for comparing dissolution profiles — as standalone tools, independent of any IVIVC model.
Background
The difference factor $f_1$ measures the percent difference between the reference ($R$) and test ($T$) profiles at each time point:
\[f_1 = \frac{\sum_{i=1}^{n} |R_i - T_i|}{\sum_{i=1}^{n} R_i} \times 100\]
Values close to zero indicate similarity; the FDA considers $f_1 < 15$ acceptable.
The similarity factor $f_2$ is a logarithmic transformation of the mean squared difference:
\[f_2 = 50 \times \log_{10}\!\left\{ \left[1 + \frac{1}{n}\sum_{i=1}^{n}(R_i - T_i)^2\right]^{-0.5} \times 100 \right\}\]
- $f_2 = 100$ when profiles are identical.
- $f_2 = 50$ corresponds to a 10% mean difference at all time points.
- $f_2 \ge 50$ is the FDA threshold for profile similarity.
Both metrics require dissolution values measured at identical time points for the reference and test products.
Setup
using InVitroInVivoCorrelation
using CairoMakie

CairoMakie.activate!(type = "svg")
Example dissolution profiles
Four Weibull-shaped formulations sampled on a typical dissolution schedule. Each profile has at most one point above 85% dissolved, as FDA guidance requires for f2:
times = [0.0, 0.5, 1.0, 2.0, 3.0, 4.0, 6.0, 8.0]
shape = 1.5

diss_A = 100.0 .* (1.0 .- exp.(-((times ./ 4.0) .^ shape)))   # fast
diss_B = 100.0 .* (1.0 .- exp.(-((times ./ 8.0) .^ shape)))   # medium
diss_C = 100.0 .* (1.0 .- exp.(-((times ./ 12.0) .^ shape)))  # slow
diss_D = 100.0 .* (1.0 .- exp.(-((times ./ 4.5) .^ shape)))   # fast, similar to A
fig = Figure(size = (700, 400))
ax = Axis(fig[1, 1];
xlabel = "Time (h)",
ylabel = "% Dissolved",
title = "Dissolution Profiles",
)
lines!(ax, times, diss_A; linewidth = 2.5, label = "FormA (fast)")
lines!(ax, times, diss_B; linewidth = 2.5, label = "FormB (medium)")
lines!(ax, times, diss_C; linewidth = 2.5, label = "FormC (slow)")
lines!(ax, times, diss_D; linewidth = 2.5, linestyle = :dash, label = "FormD (similar to A)")
hlines!(ax, [85.0]; color = :gray, linestyle = :dot, linewidth = 1, label = "85% threshold")
axislegend(ax; position = :rb)
fig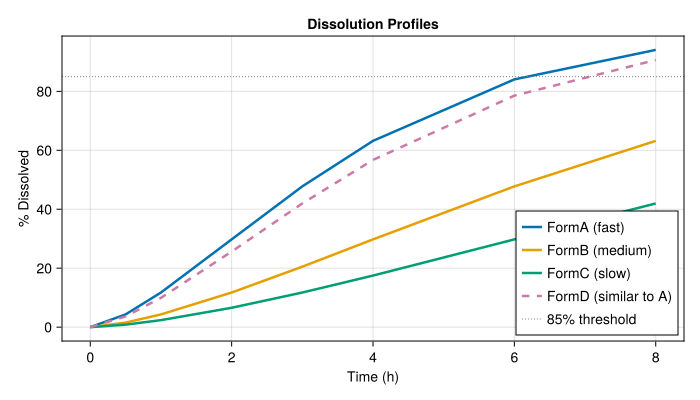
Computing f1 and f2
Pass two vectors of dissolution values measured at the same time points:
println("FormA vs FormD (similar):")
println("  f1 = ", round(f1(diss_A, diss_D); digits = 2))
println("  f2 = ", round(f2(diss_A, diss_D); digits = 2))
println()
println("FormA vs FormB (different):")
println("  f1 = ", round(f1(diss_A, diss_B); digits = 2))
println("  f2 = ", round(f2(diss_A, diss_B); digits = 2))
println()
println("FormA vs FormC (very different):")
println("  f1 = ", round(f1(diss_A, diss_C); digits = 2))
println("  f2 = ", round(f2(diss_A, diss_C); digits = 2))
FormA vs FormD (similar):
f1 = 8.31
f2 = 68.43
FormA vs FormB (different):
f1 = 46.6
f2 = 31.18
FormA vs FormC (very different):
f1 = 66.92
f2 = 22.91FormA vs FormD: f2 well above 50, similar profiles. FormA vs FormC: f2 well below 50, clearly different. Note that f1 is asymmetric (f1(R, T) != f1(T, R)) while f2 is symmetric.
Pairwise comparison matrices
using DataFrames

labels = ["FormA", "FormB", "FormC", "FormD"]
profiles = [diss_A, diss_B, diss_C, diss_D]
n = length(labels)

f2_matrix = [f2(profiles[i], profiles[j]) for i in 1:n, j in 1:n]
f1_matrix = [f1(profiles[i], profiles[j]) for i in 1:n, j in 1:n]
f2 similarity matrix
DataFrame(
    Reference = labels,
    FormA = round.(f2_matrix[:, 1]; digits = 1),
    FormB = round.(f2_matrix[:, 2]; digits = 1),
    FormC = round.(f2_matrix[:, 3]; digits = 1),
    FormD = round.(f2_matrix[:, 4]; digits = 1),
)| Row | Reference | FormA | FormB | FormC | FormD |
|---|---|---|---|---|---|
| String | Float64 | Float64 | Float64 | Float64 | |
| 1 | FormA | 100.0 | 31.2 | 22.9 | 68.4 |
| 2 | FormB | 31.2 | 100.0 | 47.1 | 35.2 |
| 3 | FormC | 22.9 | 47.1 | 100.0 | 25.5 |
| 4 | FormD | 68.4 | 35.2 | 25.5 | 100.0 |
f1 difference matrix
DataFrame(
    Reference = labels,
    FormA = round.(f1_matrix[:, 1]; digits = 1),
    FormB = round.(f1_matrix[:, 2]; digits = 1),
    FormC = round.(f1_matrix[:, 3]; digits = 1),
    FormD = round.(f1_matrix[:, 4]; digits = 1),
)| Row | Reference | FormA | FormB | FormC | FormD |
|---|---|---|---|---|---|
| String | Float64 | Float64 | Float64 | Float64 | |
| 1 | FormA | 0.0 | 46.6 | 66.9 | 8.3 |
| 2 | FormB | 87.2 | 0.0 | 38.1 | 71.7 |
| 3 | FormC | 202.3 | 61.4 | 0.0 | 177.2 |
| 4 | FormD | 9.1 | 41.8 | 63.9 | 0.0 |
Mismatched time grids
The FDA requires dissolution values at identical time points. Passing TimeValueProfile objects with different time grids throws an error:
ref = TimeValueProfile("batch1", "FormA",
    [0.0, 5.0, 10.0, 15.0, 20.0],
    [0.0, 40.0, 70.0, 90.0, 97.0])

test = TimeValueProfile("batch2", "FormB",
    [0.0, 2.0, 8.0, 14.0, 20.0],
    [0.0, 15.0, 55.0, 82.0, 95.0])

try
    f2(ref, test)
catch e
    println("ERROR: ", e.msg)
end
ERROR: Reference and test profiles must have identical time grids for f1/f2 (FDA guidance requires dissolution values measured at the same time points). Got reference times [0.0, 5.0, 10.0, 15.0, 20.0] vs test times [0.0, 2.0, 8.0, 14.0, 20.0] (in units of 1.0).FDA condition warnings
The implementation warns when the other FDA conditions are violated (fewer than 3 non-zero time points, or more than one point above 85% dissolved) but still returns the value:
println(f2([0.0, 40.0, 80.0], [0.0, 35.0, 75.0]))┌ Warning: f2: fewer than 3 non-zero dissolution time points (2 found). FDA guidance requires at least 3 time points excluding zero.
└ @ InVitroInVivoCorrelation ~/run/_work/PumasDocs.jl/PumasDocs.jl/custom_julia_depot/packages/InVitroInVivoCorrelation/RnG3I/src/DissolutionMetrics.jl:118
68.82113462797183println(f2([0.0, 25.0, 50.0, 75.0, 88.0, 95.0, 99.0],
[0.0, 22.0, 48.0, 72.0, 86.0, 93.0, 98.0]))┌ Warning: f2: reference profile has 3 time points above 85% dissolved. FDA guidance allows at most 1.
└ @ InVitroInVivoCorrelation ~/run/_work/PumasDocs.jl/PumasDocs.jl/custom_julia_depot/packages/InVitroInVivoCorrelation/RnG3I/src/DissolutionMetrics.jl:124
┌ Warning: f2: test profile has 3 time points above 85% dissolved. FDA guidance allows at most 1.
└ @ InVitroInVivoCorrelation ~/run/_work/PumasDocs.jl/PumasDocs.jl/custom_julia_depot/packages/InVitroInVivoCorrelation/RnG3I/src/DissolutionMetrics.jl:128
81.63286108493617