InVitroInVivoCorrelation.jl
Tools for Level A in vitro–in vivo correlation (IVIVC) pharmacometric modelling.
Pipeline
The package provides a complete pipeline for Level A IVIVC:
- Dissolution profiles — Load in vitro dissolution data for each formulation
- UIR fitting — Fit poly-exponential unit impulse response from IV bolus or immediate-release data
- Deconvolution — Extract absorption profiles from in vivo concentration data
- Correlation fitting — Establish a functional relationship between dissolution and absorption
- Prediction & validation — Predict in vivo behavior for held-out or new formulations
Getting started
run_ivivc runs the whole pipeline: DataFrames in, fitted model and prediction outputs out. The example runs on the Simulated Data used throughout this documentation: 20 subjects in a crossover design receive an IV bolus reference and three oral formulations (FormA–FormC), dissolution profiles exist for four formulations (FormA–FormD), sampling times differ per subject, and four profiles are missing.
PK data is one row per observation with subject, formulation, time and concentration columns; dissolution data is one row per time point with formulation, time and fraction dissolved:
first(pk_df, 5)| Row | id | formulation | time | conc |
|---|---|---|---|---|
| Int64 | String | Float64 | Float64 | |
| 1 | 1 | FormA | 0.0 | 0.0 |
| 2 | 1 | FormA | 0.479017 | 0.252104 |
| 3 | 1 | FormA | 0.940682 | 0.766301 |
| 4 | 1 | FormA | 1.5166 | 1.48553 |
| 5 | 1 | FormA | 2.0618 | 2.15264 |
first(diss_df, 5)| Row | formulation | time | diss |
|---|---|---|---|
| String | Float64 | Float64 | |
| 1 | FormA | 0.0 | 0.0 |
| 2 | FormA | 0.521124 | 0.0463696 |
| 3 | FormA | 1.07457 | 0.130579 |
| 4 | FormA | 1.41023 | 0.189439 |
| 5 | FormA | 1.9815 | 0.294384 |
fast_formulation names the reference formulation the unit impulse responses are fitted to, and validation_formulation keeps one formulation out of the correlation fit so its prediction can be checked against the observed data:
result = run_ivivc(
    pk_df,
    diss_df;
    fast_formulation = "IV",
    validation_formulation = "FormB",
);
Every exclusion a pipeline stage makes is recorded with its stage and reason. Subject 1 has no IV profile: no unit impulse response can be fitted, and the subject's three oral profiles cannot be deconvolved.
DataFrame(result.skipped)| Row | id | stage | reason |
|---|---|---|---|
| Int64 | Symbol | String | |
| 1 | 1 | uir_fit | no profile for fast_formulation=IV |
| 2 | 1 | deconvolution | no fitted UIR available (formulation=FormA) |
| 3 | 1 | deconvolution | no fitted UIR available (formulation=FormB) |
| 4 | 1 | deconvolution | no fitted UIR available (formulation=FormC) |
The fitted AffineTimeLinearModel maps in vivo time to in vitro time (time_scale, time_shift) and fraction dissolved to fraction absorbed (abs_scale, abs_intercept). The simulation makes in vivo absorption 1.2 times slower than in vitro dissolution, so the true values are a time scale of 1/1.2 ≈ 0.83, no time shift, unit slope and zero intercept:
coeftable(result.model)| Row | parameter | constant | estimate |
|---|---|---|---|
| Symbol | Bool | Float64 | |
| 1 | abs_scale | false | 0.990322 |
| 2 | abs_intercept | false | 0.00106438 |
| 3 | time_scale | false | 0.842282 |
| 4 | time_shift | false | -0.0818941 |
The held-out formulation is predicted and scored against the observed mean profile. The prediction error follows the FDA convention, %PE = (observed - predicted) / observed × 100 on AUC and Cmax, so a positive value means the model under-predicts. The acceptance criterion applies to absolute values: mean |%PE| ≤ 10% and individual |%PE| ≤ 15%.
result.pe_summary_df| Row | formulation | auc_predicted | auc_observed | pe_auc | cmax_predicted | cmax_observed | pe_cmax |
|---|---|---|---|---|---|---|---|
| String | Float64 | Float64 | Float64 | Float64 | Float64 | Float64 | |
| 1 | FormB | 50.0624 | 50.456 | 0.7802 | 2.85912 | 2.87857 | 0.675749 |
Plot recipes take the result directly:
ivivc_correlation(result)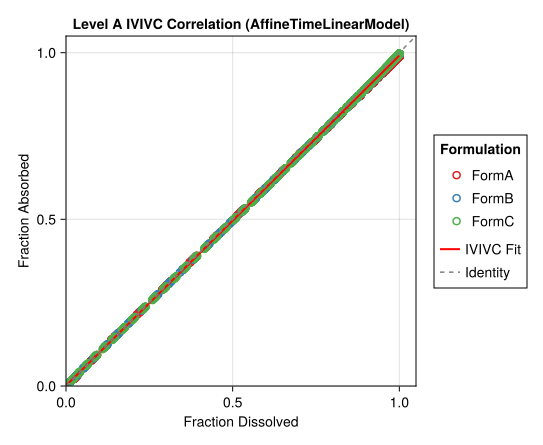
levy_plot(result)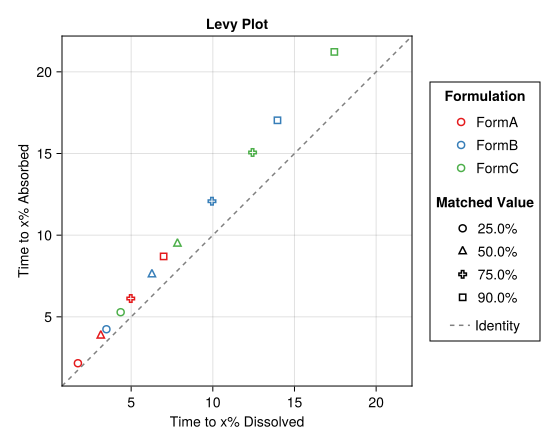
concentration_profiles(result; kind = :validation, formulation = "FormB")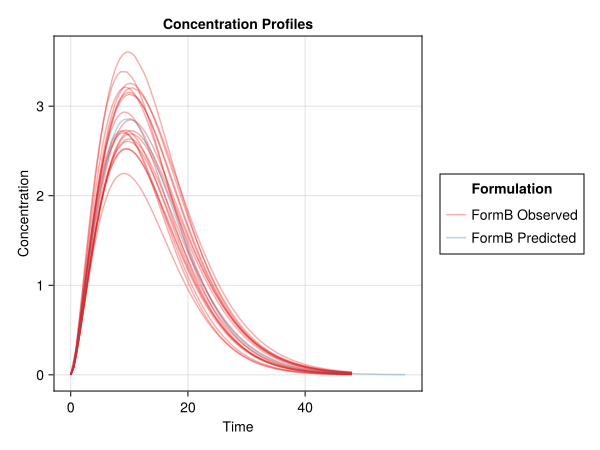
The how-to guides adapt this workflow to other study designs and inputs, and the Low-Level API page runs the same analysis one stage at a time.